The Standard Reports page allows you to create various reports, such as: Overall Risk Reports, Threat Reports, Opportunity Reports, Mitigation Reports, Audit Reports and Exports. The process to create a report is broken down into steps to make it easier for users to follow. Reports from this page can be added to the Manager’s Dashboard for further analysis and reporting. This page can be viewed by only those users who have either Read/Write or View access.
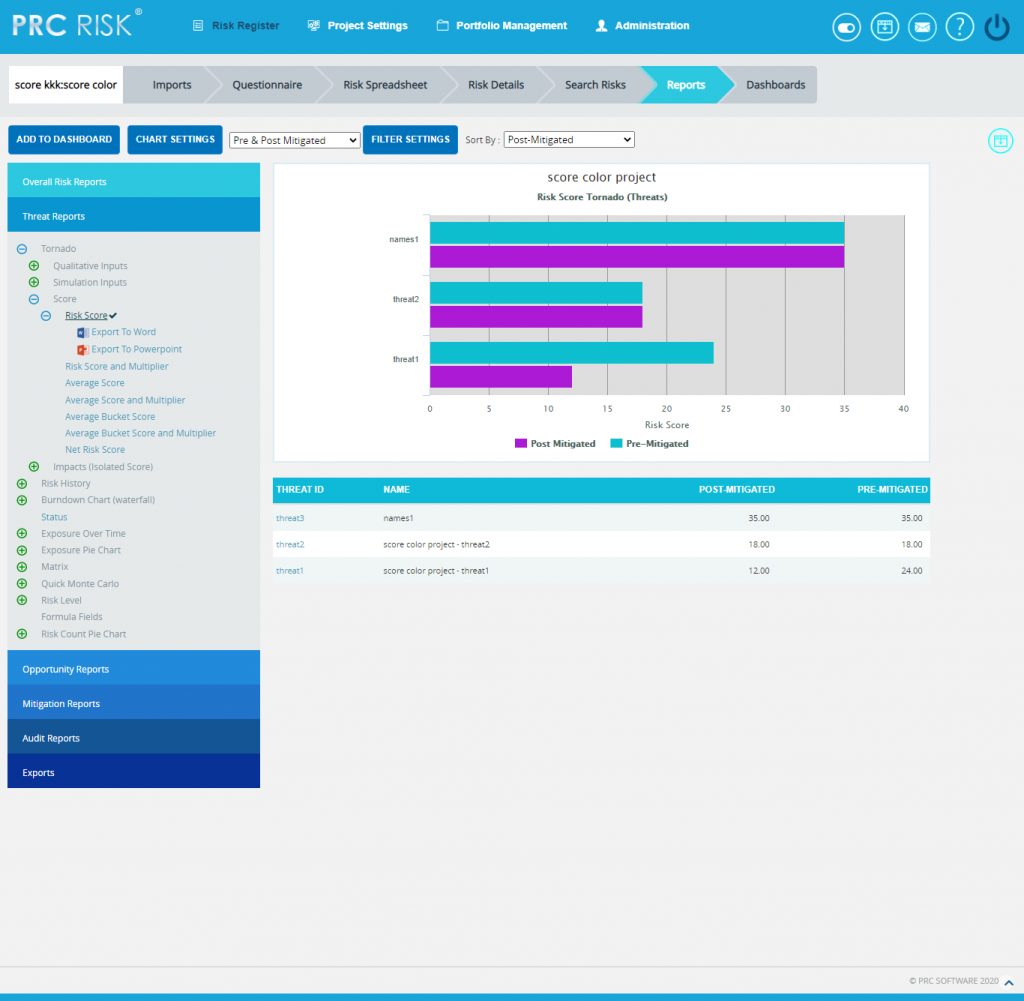
Figure 1
Set as Default Chart Icon:
Set as Default Icon is used to set any chart as the landing page when we select Reports of Risk Register. Risk score is the chart to appear first by default. (Figure 1)
Reports:
There are several types of reports in the Standard Reports (Project) page. In order to generate a chart, the primary option that should be selected is Reports. The Reports selected by default (while the page is loaded) is Risk Tornado. The various available reports are shown in Figure 2.
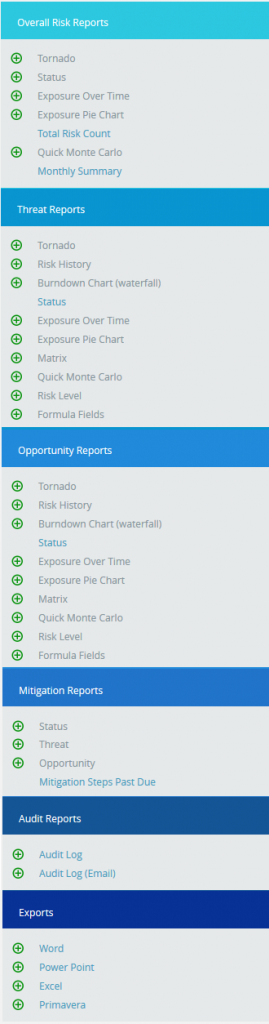
Figure 2
Report Option:
The Report Option decides for which risk type the chart should be generated. The risk type listed will vary for Status Reports. For all other reports it remains the same. The report option for all other reports is shown in Figure 3, Figure 4, Figure 5, Figure 6 and 7.
The report option for Tornado charts, Risk Exposure charts and Risk exposure-BS charts are Threat Tornado, Opportunity Tornado, Threat Exposure Over Time, Opportunity Exposure Over Time, Threat Qualitative Exposure Pie Chart, Opportunity Qualitative Exposure Pie Chart, Threat Simulation Exposure Pie Chart and Opportunity Simulation Exposure Pie Chart.
Risk Tornado Charts:
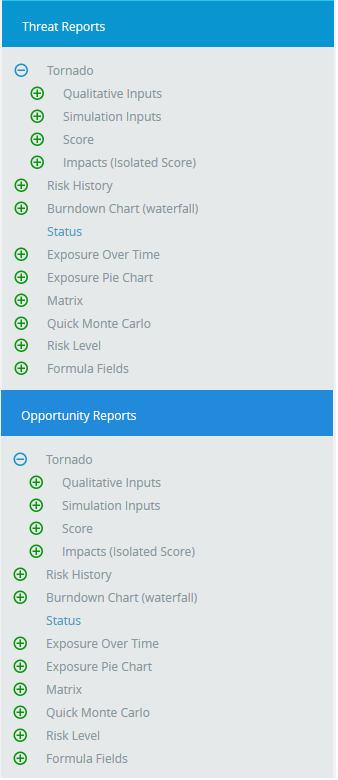
Figure 3
Risk Exposure Charts:
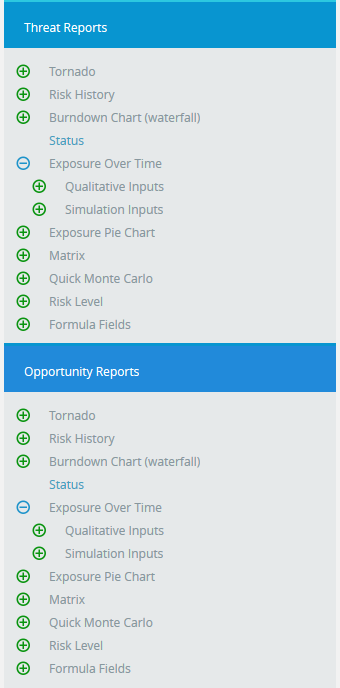
Figure 4
Risk Exposure Pie Charts:
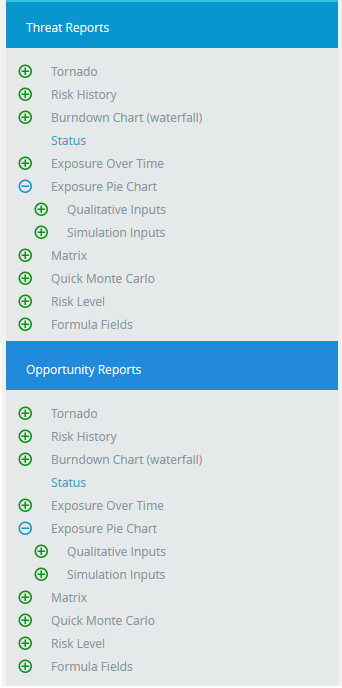
Figure 5
Risk History Charts:
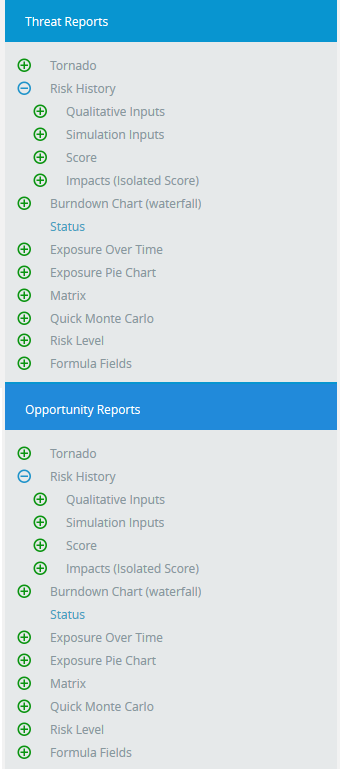
Figure 6
Status Charts:
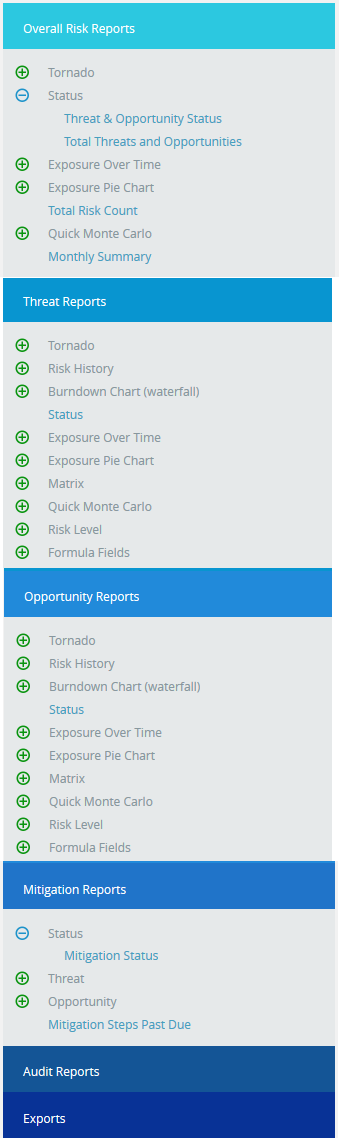
Figure 7
Risk:
Risk should be selected for Risk History and the Burndown Chart (Waterfall) using the Select Risk dropdown. (Figure 8) This dropdown is visible for only Risk History and the Burndown Chart (Waterfall).
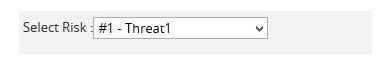
Figure 8
Data Option:
The Data Options include additional impacts, if any. The various data options available for Risk Tornado, Risk History, and Burndown (Waterfall) are:
-
Risk Score
- Risk Score and Multiplier
- Average Score
- Average Score and Multiplier
- Average Bucket Score
- Average Bucket Score and Multiplier
- Other Qualitative impacts
-
Qualitative Cost
-
Qualitative Schedule
-
Qualitative Probability
- Qualitative Cost Exposure
- Qualitative Schedule Exposure
-
Simulation Cost
-
Simulation Schedule
-
Simulation Probability
-
Simulation Cost Exposure
-
Simulation Schedule Exposure
- Mitigation Started Late (Days)
- Mitigation Finished Late (Days)
- Mitigation Qualitative Cost
- Mitigation Qualitative Schedule
- Mitigation Qualitative Probability
- Mitigation Qualitative Cost Exposure
- Mitigation Qualitative Schedule Exposure
- Mitigation Simulation Cost
- Mitigation Simulation Schedule
- Mitigation Simulation Probability
- Mitigation Simulation Cost Exposure
- Mitigation Simulation Schedule Exposure
- Mitigation Risk Score
- Mitigation Risk Score and Multiplier
- Mitigation Average Score
- Mitigation Average Score and Multiplier
- Mitigation Average Bucket Score
- Mitigation Average Bucket Score and Multiplier
For Example:
Consider the following 3 x 5 matrix
|
VL |
L |
M |
H |
VH |
|
|
H |
3 |
6 |
9 |
12 |
30 |
|
M |
2 |
4 |
6 |
8 |
20 |
|
L |
1 |
2 |
3 |
4 |
10 |
Table 1
Multiplier = 2
Probability Range = L (Low), M (Medium), H (High)
Impact Range = VL, L, M, H, VH
Impacts = Cost, Schedule, Safety
Consider, Probability = H
Cost = H
Schedule = M
Safety = L
1. Risk Score:
By taking the combination of probability and all the impacts like schedule, cost etc., the highest of combination value in risk matrix is taken as Risk Score. The Risk Score for Threat/Opportunity is the Pre-Mitigated score. The Risk Score for Mitigation is the Post-Mitigated score.
In the Example, (Table 1)
Risk score = High Probability x High Cost = 12
2. Risk Score and Multiplier:
The Multiplier value setting can be done in the Project Settings Scoring System. Then the formula for Risk Score and Multiplier is, Risk Score and Multiplier = Risk score * Multiplier
In the Example, (Table 1)
Risk Score and Multiplier = 12 * 2 = 24
3.Average Score:
The Average Score is the sum of all the impact combinations (cost, schedule etc) with the probability in the risk matrix, divided by number of combinations.
In the Example, (Table 1)
Average Score = (6 + 9 + 12)/3 = 9
4.Average Score and Multiplier:
The Multiplier value setting can be done in the Project settings Scoring System. Then the formula for Average Score and Multiplier is, Average Score and Multiplier = Average score * Multiplier
In the Example, (Table 1)
Average score = (6 + 9 + 12)/3 =9 *Multiplier = 9 * 2 = 18
5.Average Bucket Score:
Bucket value is the index values given to each impacts. The Average Impact is the sum of the bucket values or index values of all the impact combinations with probability, by number of combinations. This Average Impact is considered as the index value for the Risk Matrix table. The value on this table corresponding to this index value is considered as the Average Bucket Score.
Note: If the calculated value of the bucket falls to say 3.66, round it to the nearest bucket which is 4
In the Example, (Table 2)
|
VL |
L |
M |
H |
VH |
|
|
H |
3 |
6 |
9 |
12 |
30 |
|
M |
2 |
4 |
6 |
8 |
20 |
|
L |
1 |
2 |
3 |
4 |
10 |
|
1 |
2 |
3 |
4 |
5 |
Table 2
Average Impact = High Probability x ((Low (bucket value ) + Medium (bucket value ) + High (bucket value )) / 3
i.e., High probability x bucket value of (2 + 3 + 4) / 3 = 3
So here, the value corresponding to the index value 3 is 9 which is the Average Bucket Score.
6.Average Bucket Score and Multiplier:
The Multiplier value setting can be done in the Project settings Scoring System. Then the formula for Average Bucket Score and Multiplier is, Average Bucket Score and Multiplier = Average Bucket score * Multiplier
Average Bucket score= 9* 2 = 18
7.Other Qualitative Impacts:
The formulas for Additional Impacts are:
-
[(Qualitative Additional Impact Upper Limit + Qualitative Additional Impact Lower Limit) / 2] (Pre-Value)
-
[(Qualitative Mitigation Additional Impact Upper Limit + Qualitative Mitigation Additional Impact Lower Limit) / 2] (Post Value)
If there is no upper limit: Average value = lower limit * 1.5
If there is no lower limit: Average value = upper limit / 2
8.Qualitative Cost:
The formulas for Qualitative Cost are:
-
[(Qualitative Cost Upper Limit + Qualitative Cost Lower Limit) / 2] . (Pre-Value)
-
[(Qualitative Mitigation Cost Upper Limit + Qualitative Mitigation Cost Lower Limit) / 2] . (Post-Value)
If there is no upper limit: Qualitative Cost = lower limit * 1.5
If there is no lower limit: Qualitative Cost = upper limit / 2
9.Qualitative Schedule:
The formulas for Qualitative Schedule are:
-
[(Qualitative Schedule Upper Limit + Qualitative Schedule Lower Limit) / 2] . (Pre-Value)
-
[(Qualitative Mitigation Schedule Upper Limit + Qualitative Mitigation Schedule Lower Limit) / 2] . (Post-Value)
If there is no upper limit: Qualitative Schedule = lower limit * 1.5
If there is no lower limit: Qualitative Schedule = upper limit / 2
10.Qualitative Probability:
-
[[(Qualitative Probability Upper Limit + Qualitative Probability Lower Limit) / 2 ]] (Pre-Value)
-
[[(Qualitative Mitigation Probability Upper Limit + Qualitative Probability Lower Limit) / 2]] (Post-Value)
If there is no upper limit: Qualitative Probability = [(lower-limit + 100) / 2]
If there is no lower limit: Qualitative Probability = [(0+upper-limit) / 2]
11.Qualitative Cost Exposure:
The formulas for Qualitative Cost Exposure are:
- [(Qualitative Cost * Qualitative Probability) / 100] (Pre-Value)
- [(Mitigation Qualitative Cost * Mitigation Qualitative Probability) / 100] (Post-Value)
12.Qualitative Schedule Exposure:
The formulas for Qualitative Schedule Exposure are:
- [(Qualitative Schedule * Qualitative Probability) / 100] (Pre-Value)
- [(Mitigation Qualitative Schedule * Mitigation Qualitative Probability) / 100] (Post-Value)
13.Simulation Cost:
The formulas for Simulation Cost are:
-
[(Cost min + Cost max + 4 * (Cost Most likely)) / 6] (Pre Value)
-
[(Mitigation Cost min + Mitigation Cost max + 4 * ( Mitigation Cost Most likely)) / 6] (Post Value)
If there is no max then max = min * 2
If there is no min then min = max / 2
If there is no most likely then Avg = [(Min + Max) / 2]
14.Simulation Schedule:
The formulas for Simulation Schedule are:
-
[(Schedule min + Schedule max + 4 * ( Schedule Most likely)) / 6] (Pre-Value)
-
[(Mitigation Schedule min + Mitigation Schedule max + 4 * ( Mitigation Schedule Most likely)) / 6] (Post-Value)
If there is no max then max = min * 2
If there is no min then min = max / 2
If there is no most likely then Avg = [(Min + Max) / 2]
15.Simulation Probability:
The formulas for Simulation Probability are:
-
[[Simulation Probability Percentage]] (Pre-Value)
-
[[Mitigation Simulation Probability]] (Post-Value)
16.Simulation Cost Exposure:
The formulas for Simulation Cost Exposure are:
-
[(Simulation Cost * Simulation Probability) / 100] (Pre-Value)
-
[(Mitigation Simulation Cost * Mitigation Simulation Probability) / 100] (Post-Value)
17.Simulation Schedule Exposure:
The formulas for Simulation Schedule Exposure are:
-
[(Simulation Schedule * Simulation Probability) / 100] (Pre-Value)
-
[(Mitigation Simulation Schedule * Mitigation Simulation Probability) / 100] (Post-Value)
18.Mitigation Started Late (Days):
The formula to calculate the Mitigation Started Late (Days) is:
No of days late = Positive value of proposed date – Current date
Condition: Risk status should not be closed and Mitigation should not be in Progress, Rejected, Completed status.
19.Mitigation Finished Late (Days):
The formula to calculate the Mitigation Finished Late (Days) is:
No of days late = Proposed finish date – current date (Positive value)
Condition: Risk status should not be closed, and Mitigation should not be in Completed, Rejected status.
20.Mitigation Qualitative Cost:
The formula for Mitigation Cost if only one risk is mapped is:
[Risk Cost – Mitigation Cost]
The formula for Mitigation Cost if more than one risk is mapped is:
[(Cost of first Risk – Mitigation Cost) + (Cost of second Risk – Mitigation Cost) + …..]
21.Mitigation Qualitative Schedule:
The formula for Mitigation Schedule if only one risk is mapped is:
[Risk Schedule – Mitigation Schedule]
The formula for Mitigation Schedule if more than one risk is mapped is:
[(Schedule of first Risk – Mitigation Schedule) + (Schedule of second Risk – Mitigation Schedule) + …..]
22.Mitigation Qualitative Probability:
The formula for Mitigation Probability if only one risk is mapped is:
[Risk Probability – Mitigation Probability]
The formula for Mitigation Probability if more than one risk is mapped is:
[(Probability of first Risk – Mitigation Probability) + (Probability of second Risk – Mitigation Probability) + …..]
23.Mitigation Qualitative Cost Exposure:
The formula for Mitigation Cost Exposure if only one risk is mapped is:
[Risk Cost Exposure – Mitigation Cost Exposure]
The formula for Mitigation Cost Exposure if more than one risk is mapped is:
[(Cost Exposure of first Risk – Mitigation Cost Exposure) + (Cost Exposure of second Risk – Mitigation Cost Exposure) + …..]
24.Mitigation Qualitative Schedule Exposure:
The formula for Mitigation Schedule Exposure if only one risk is mapped is:
[Risk Schedule Exposure – Mitigation Schedule Exposure]
The formula for Mitigation Schedule Exposure if more than one risk is mapped is:
[(Schedule Exposure of first Risk – Mitigation Schedule Exposure) + (Schedule Exposure of second Risk – Mitigation Schedule Exposure) + …..]
25.Mitigation Simulation Cost:
The formula for Mitigation Simulation Cost if only one risk is mapped is:
[Risk Simulation Cost – Mitigation Simulation Cost]
The formula for Mitigation Simulation Cost if more than one risk is mapped is:
[(Simulation Cost of first Risk – Mitigation Simulation Cost) + (Simulation Cost of second Risk – Mitigation Simulation Cost) + …..]
26.Mitigation Simulation Schedule:
The formula for Mitigation Simulation Schedule if only one risk is mapped is:
[Risk Simulation Schedule – Mitigation Simulation Schedule]
The formula for Mitigation Simulation Schedule if more than one risk is mapped is:
[(Simulation Schedule of first Risk – Mitigation Simulation Schedule) + (Simulation Schedule of second Risk – Mitigation Simulation Schedule) + …..]
27.Mitigation Simulation Probability:
The formula for Mitigation Simulation Probability if only one risk is mapped is:
[Risk Simulation Probability – Mitigation Simulation Probability]
The formula for Mitigation Simulation Probability if more than one risk is mapped is:
[(Simulation Probability of first Risk – Mitigation Simulation Probability) + (Simulation Probability of second Risk – Mitigation Simulation Probability) + …..]
28.Mitigation Simulation Cost Exposure:
The formula for Mitigation Simulation Cost Exposure if only one risk is mapped is:
[Risk Simulation Cost Exposure – Mitigation Simulation Cost Exposure]
The formula for Mitigation Simulation Cost Exposure if more than one risk is mapped is:
[(Simulation Cost Exposure of first Risk – Mitigation Simulation Cost Exposure) + (Simulation Cost Exposure of second Risk – Mitigation Simulation Cost Exposure) + …..]
29.Mitigation Simulation Schedule Exposure:
The formula for Mitigation Simulation Schedule Exposure if only one risk is mapped is:
[Risk Simulation Schedule Exposure – Mitigation Simulation Schedule Exposure]
The formula for Mitigation Simulation Schedule Exposure if more than one risk is mapped is:
[(Simulation Schedule Exposure of first Risk – Mitigation Simulation Schedule Exposure) + (Simulation Schedule Exposure of second Risk – Mitigation Simulation Schedule Exposure) + …..]
30.Mitigation Risk Score:
The formula for Mitigation Risk Score if only one risk is mapped is:
[Pre Mitigated Risk Score – Post Mitigated Score]
The formula for Mitigation Risk Score if more than one risk is mapped is:
[(Pre Mitigated Risk Score of first Risk – Post Mitigated Score) + (Pre Mitigated Risk Score of second Risk – Post Mitigated Score) + …..]
31.Mitigation Risk Score and Multiplier:
The formula for Mitigation Risk Score and multiplier if only one risk is mapped is:
[Pre Mitigated Risk Score and multiplier – Post Mitigated Score and multiplier]
The formula for Mitigation Risk Score and multiplier if more than one risk is mapped is:
[(Pre Mitigated Risk Score and multiplier of first Risk – Post Mitigated Score and multiplier) + (Pre Mitigated Risk Score and multiplier of second Risk – Post Mitigated Score and multiplier) + …..]
32.Mitigation Average Score:
The formula for Mitigation Average Risk Score if only one risk is mapped is:
[Pre Mitigated Average Risk Score- Post Mitigated Average Score]
The formula for Mitigation Average Risk Score if more than one risk is mapped is:
[(Pre Mitigated Average Risk Score of first Risk – Post Mitigated Average Score) + (Pre Mitigated Average Risk Score of second Risk – Post Mitigated Average Score) + …..]
33.Mitigation Average Score and Multiplier:
The formula for Mitigation Average Score and multiplier if only one risk is mapped is:
[Pre Mitigated Average Score and multiplier – Post Mitigated Average Score and multiplier]
The formula for Mitigation Average Score and multiplier if more than one risk is mapped is:
[(Pre Mitigated Average Score and multiplier of first Risk – Post Mitigated Average Score and multiplier) + (Pre Mitigated Average Score and multiplier of second Risk – Post Mitigated Average Score and multiplier) + …..]
34.Mitigation Average Bucket Score:
The formula for Mitigation Average Bucket Score if only one risk is mapped is:
[Pre Mitigated Average Bucket Score- Post Mitigated Average Bucket Score]
The formula for Mitigation Average Bucket Score if more than one risk is mapped is:
[(Pre Mitigated Average Bucket Score of first Risk – Post Mitigated Average Bucket Score) + (Pre Mitigated Average Bucket Score of second Risk – Post Mitigated Average Bucket Score) + …..]
35.Mitigation Average Bucket Score and Multiplier:
The formula for Mitigation Average Bucket Score and Multiplier if only one risk is mapped is:
[Pre Mitigated Average Bucket Score and multiplier – Post Mitigated Average Bucket Score and multiplier]
The formula for Mitigation Average Bucket Score and Multiplier if more than one risk is mapped is:
[(Pre Mitigated Average Bucket Score and multiplier of first Risk – Post Mitigated Average Bucket Score and multiplier) + (Pre Mitigated Average Bucket Score and multiplier of second Risk – Post Mitigated Average Bucket Score and multiplier) + …..]
The various data options for Threat Qualitative Exposure Pie Chart, Opportunity Qualitative Exposure Pie Chart, Threat Simulation Exposure Pie Chart and Opportunity Simulation Exposure Pie Chart are:
-
Project-OBS
-
Project-WBS
-
Project-RBS
-
Business Unit-OBS
-
Business Unit-WBS
-
Business Unit-RBS
-
Enterprise-OBS
-
Enterprise-WBS
-
Enterprise-RBS
-
Risk Owner
Project OBS, Project WBS and Project RBS details are added from the page Project Breakdown Structure (Project Settings —> Project Breakdown Structure)
Business OBS, Business RBS, Business WBS, Enterprise OBS, Enterprise RBS, Enterprise WBS are added from the page Manage Breakdown Structure (Portfolio Management —>Manage Breakdown Structure)
Enterprise Risk details are added from page:
Portfolio Management —> Reports —> Other Risk Reports —> Enterprise Risk List
In Figure 9, there is an option to select (Pre-Mitigated/Post-Mitigated or Pre-Mitigated & Post-Mitigated). The various data options for Threat Qualitative Exposure Pie Chart, Opportunity Qualitative Exposure Pie Chart, Threat Simulation Exposure Pie Chart and Opportunity Simulation Exposure Pie Chart are shown in Figure 9.
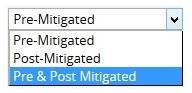
Figure 9
Sort By:
This functionality is used to sort the data for the selected report based on Post-Mitigated and Pre-Mitigated
Steps:
- Risk Register —> Reports.
- Select the Sort By dropdown to sort the report based on Post-Mitigated and Pre-Mitigated. (Figure 1)
Filter:
This functionality is used to apply the Filter to the chart.
Steps:
-
Risk Register—> Reports
-
Click the FILTER SETTINGS. (Figure 10) The pop up shown in Figure 11 appears.
-
Select the field from the Select Field dropdown. (Figure 11)
-
Select the Operator from the Select Operator dropdown. (Figure 11) The various fields and the operators applicable are shown in Table 1.
-
The User can select values or enter values from the SELECT VALUE dropdown. (Figure 11)
-
Click the ADD FILTER OPTION button to add another filter. (Figure 11)
- Click the APPLY FILTER button to view the filtered report. Or give name, description and global access option, and then click the SAVE AND APPLY FILTER button to view the saved filter report. (Figure 11)
- Select the filter name from the Name dropdown and click the DELETE button that appears, to delete that particular saved filter. (Figure 11)
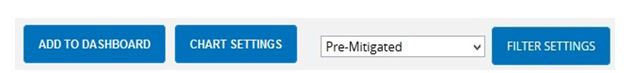
Figure 10
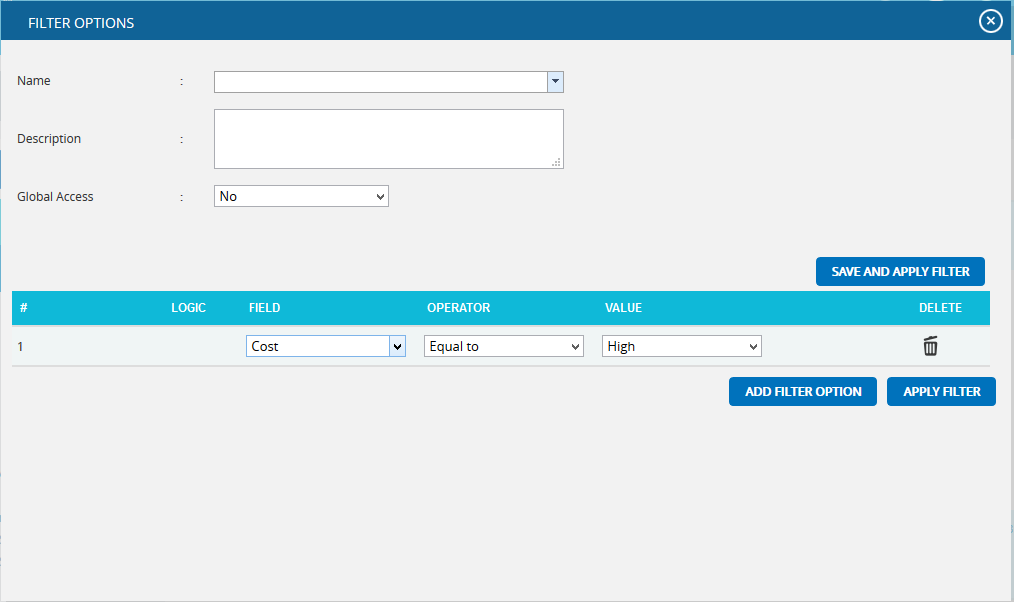
Figure 11
| Field Type | Operator | Notes |
| Text | Equal to | User types text-This chart contains all the values that match the text exactly. |
| Contains | User types text-This chart contains all the values that contain the text anywhere in the string. | |
| Not equal to | User types text-This chart contains all the values that do not match exactly. | |
| Does not contain | User types text-This chart contains all values where the text is not contained anywhere in the string. | |
| Date | Equal to | Date popup box-This chart contains all values where the date matches exactly. |
| Before | Date popup box-This chart contains all values where the date is before the selected date. | |
| After | Date popup box-This chart contains all values where the date is after the selected date. | |
| Not equal to | Date popup box-This chart contains all values where the date does not match exactly. | |
| Number | Equal to | User enters number-This chart contains all values which match exactly with the number entered. |
| Greater than | User enters number-This chart contains all values greater than the number entered. | |
| Greater than or Equal to | User enters number-This chart contains all values greater than or equal to the number entered. | |
| Less than | User entered number-This chart contains all values less than or equal to the number entered. | |
| Less than or equal to | User enters number-This chart contains all values less than the number entered | |
| Not equal to | User enters number-This chart contains all values which are not the exact match for the number entered. | |
| WBS/OBS/RBS | Under | User selects WBS/OBS/RBS element via a check mark in a popup-All children under the node (and sub-nodes) are shown. If a user check marks Multiple Items, an OR is applied to all check-marked items. |
| Not Under | User selects WBS/OBS/RBS element via a check mark in a popup-All items are shown except children under the node (and sub-nodes). | |
| List Items (such as status) | Equal to | User selects list element from a dropdown box-This chart will contain all the values which match the selected value exactly. |
| Equal to (select multiple) | User selects list element via a check mark in a popup-If a user check marks multiple items, then an OR is applied to all checked items. This chart will contain all values which match the selected values exactly. | |
| Not equal to | User selects list element from a dropdown box-This chart contains all values not equal to the selected value | |
| Contains | User selects list element from a dropdown box-This chart contains all values which contain the selected value | |
| Not equal to (select multiple) | User selects list element via a check mark in a popup-If the user checks multiple items an OR is applied to all checked items, and the results will not be equal to any checked items. This chart contains all values not equal to the selected values |
Table 3
Tornado Chart:
Tornado Diagrams, also called Tornado Plots or Tornado Charts, are special types of Bar Charts where the data categories are listed vertically. These charts are generated by default when the Standard Reports (Project) page is initially loaded. The Post-Mitigated score is the Mitigation score and Pre-Mitigated score is the risk score.
Threat Tornado:
The Threat Tornado chart corresponds to all the threats in the selected project.
Steps:
-
Risk Register —> Reports
-
Click the Threat Reports link to select Threat Tornado Chart. (Figure 1)
-
Select Pre-Mitigated to view Pre-Mitigated data only (sorted by Pre-Mitigated), Post-Mitigated to view Post-Mitigated data (sorted by Post-Mitigated) or Both to view both Pre-Mitigated data and Post-Mitigated data from the dropdown. (Figure 10)
- Click the FILTER SETTINGS button to add a filter. (Steps to be followed to add a filter are explained in filter section above). (Figure 10)
- Click the Risk Score data option or any other data option to generate the report. (Figure 12) The chart generated and the data table is shown in Figure 13.
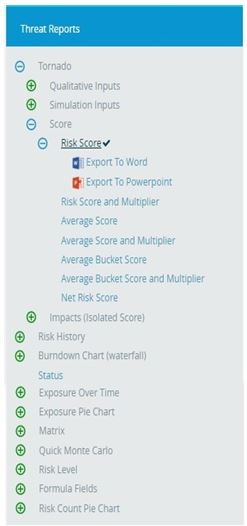
Figure 12
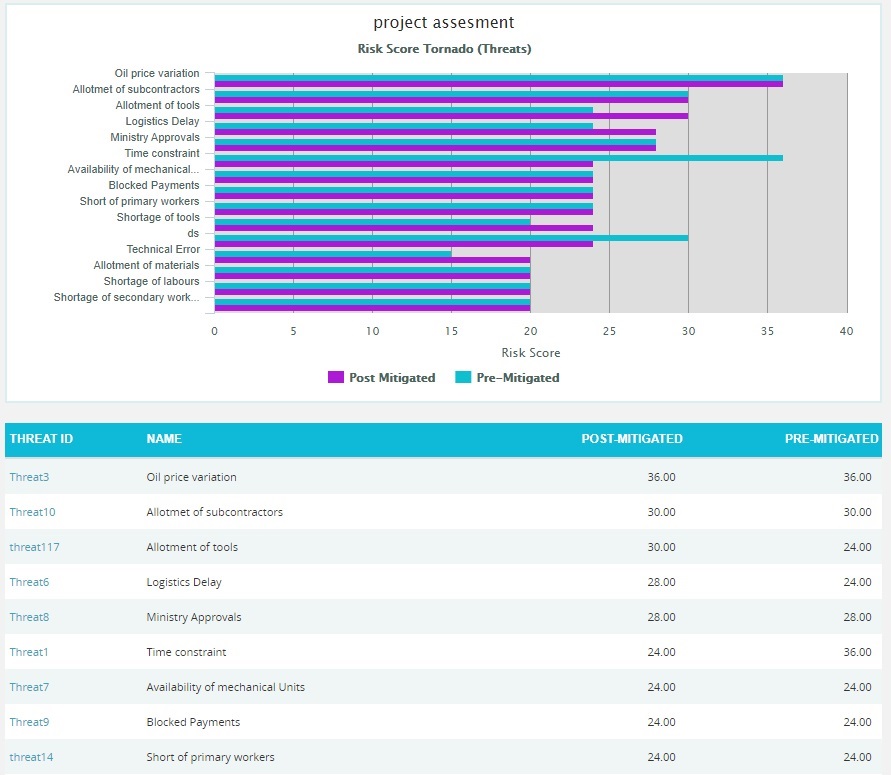
Figure 13
Clicking on the Risk ID shown in the data table in Figure 13 navigates to the page:
Risk Register —> Risk Details (Threats)
Threat Net Risk Score:
The Threat Net Risk Score Chart shows the net risk score of each threat in a project. The impact types (cost, schedule, safety, etc.) are isolated and evaluated using the probability input. Each threat is ranked individually for all impact types. A threat with a qualitative score of high for cost and high for schedule will have a higher cumulative score than a threat with qualitative scores of high/medium (cost/schedule). Typical risk scoring may only show the highest impact type instead of isolating the impact types. The further breakdown can help to analyze the root cause of a threat receiving a high risk score. It shows only 5 threats in the chart and 20 threats in the table below the chart according to the option Pre Mitigated or Post Mitigated selected from the dropdown. The top 3 impacts are shown separately in the chart and the accumulative score for all other impacts are shown using the score value other impacts.
Steps:
- Risk Register —> Reports
- Click the Threat Reports link to select Threat Tornado Chart. (Figure 14)
- Click the Net Risk Score link to view the net risk score of each threat in the selected project. (Figure 14)
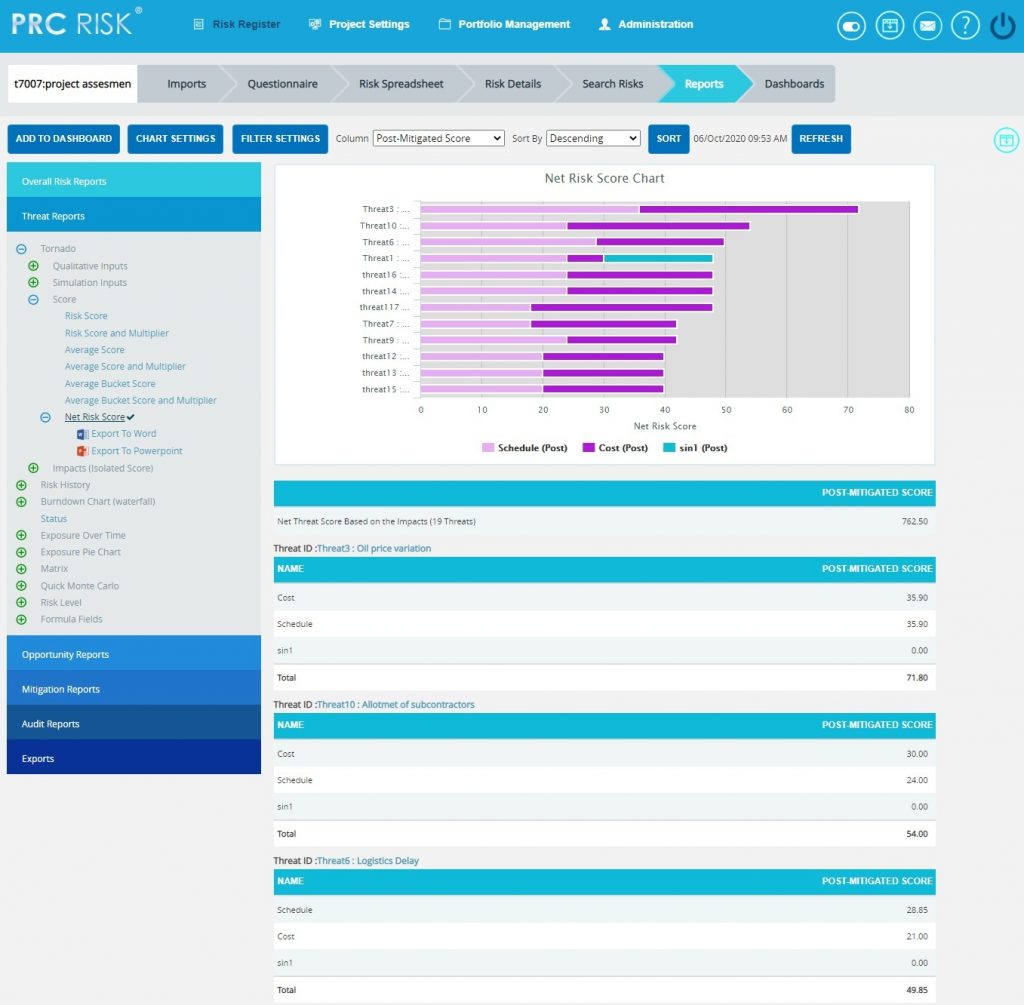
Figure 14
The table below the chart contains each threat´s id and name link (Figure 14) that navigates the user to the Risk Details page of that particular threat.
Filter:
This functionality is used to apply the Filter to the Net Risk Score chart based on the impact types. It shows all the impacts by default.
Steps:
-
Risk Register —> Reports
-
Click the Opportunity Reports link to select Opportunity Tornado Chart. (Figure 18)
- Click the Net Risk Score link to view the net risk score of each opportunity in the selected project.
- Click the FILTER SETTINGS button. (Figure 19) A pop up shown in Figure appears.
- Select the impacts to be shown with their scores and click the LOAD IMPACT SCORES button. (Figure 19)
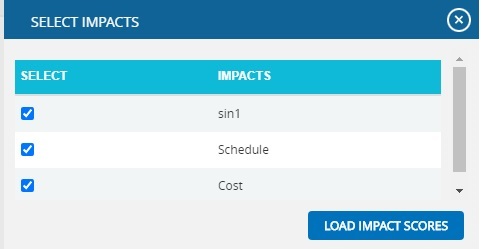
Figure 15
Sort By:
This functionality is used to sort the data for the Net Risk Score chart in ascending or descending order based on the sum of the impact scores.
Steps:
- Risk Register —> Reports
- Click the Threat Reports link to select Threat Tornado Chart. (Figure 14)
- Click the Net Risk Score link to view the net risk score of each threat in the selected project.
- Select the Sort By drop-down to sort the report in ascending or descending order based on the sum of the impact scores. (Figure 14)
- Click the SORT button. (Figure 14)
Refresh:
This functionality is used to refresh the chart with the most recently added threat in the project. To refresh the chart, click the REFRESH button. (Figure 14)
Opportunity Tornado:
Opportunity Tornado chart corresponds to all the opportunities in the selected project.
Steps:
-
Risk Register —> Reports
-
Click the Opportunity Reports link to select Opportunity Tornado Chart. (Figure 1)
-
Select Pre-Mitigated to view Pre-Mitigated data only (sorted by Pre-Mitigated), Post-Mitigated to view Post-Mitigated data (sorted by Post-Mitigated) or Both to view both Pre-Mitigated data and Post-Mitigated data from the dropdown. (Figure 10)
- Click the FILTER SETTINGS button to add a filter. (Steps to be followed to add a filter are explained in the filter section above) (Figure 10)
- Click the Risk Score data option or any other data option to generate the report. (Figure 16) The chart generated and the data table is shown in Figure 17.
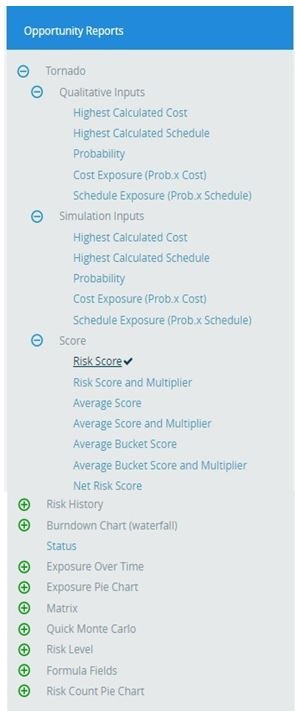
Figure 16
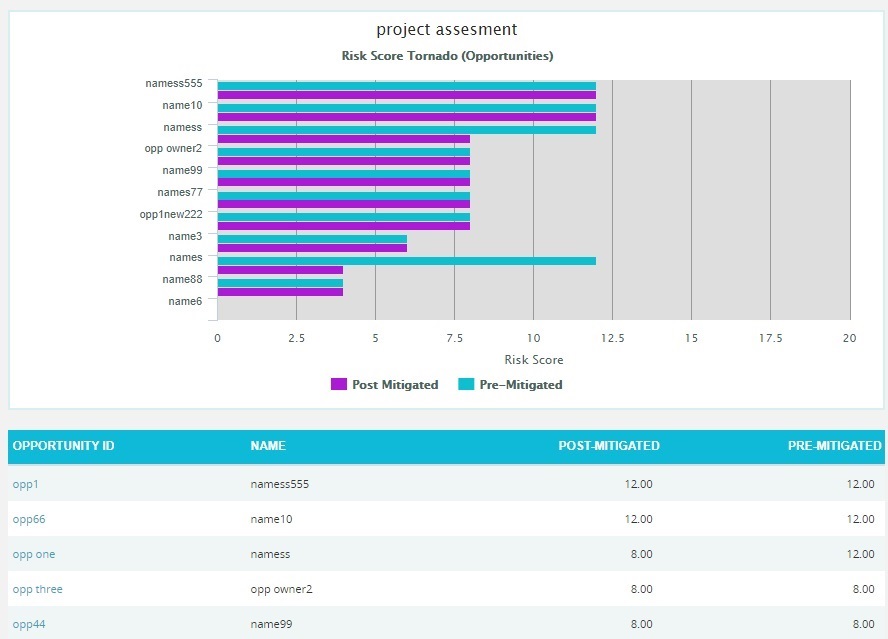 Figure 17
Clicking on the Risk ID shown in the data table in Figure 15 navigates to the page:
Risk Register —> Risk Details (Opportunities)
Opportunity Net Risk Score:
The Opportunity Net Risk Score Chart shows the net risk score of each opportunity in a project. The impact types (cost, schedule, safety, etc.) are isolated and evaluated using the probability input. Each opportunity is ranked individually for all impact types. An opportunity with a qualitative score of high for cost and high for schedule will have a higher cumulative score than an opportunity with qualitative scores of high/medium (cost/schedule). Typical risk scoring may only show the highest impact type instead of isolating the impact types. The further breakdown can help to analyze the root cause of an opportunity receiving a high risk score. It shows only 5 opportunities in the chart and 20 opportunities in the table below the chart.
Steps:
- Risk Register —> Reports
- Click the Opportunity Reports link to select Opportunity Tornado Chart. (Figure 18)
- Click the Net Risk Score link to view the net risk score of each opportunity in the selected project.
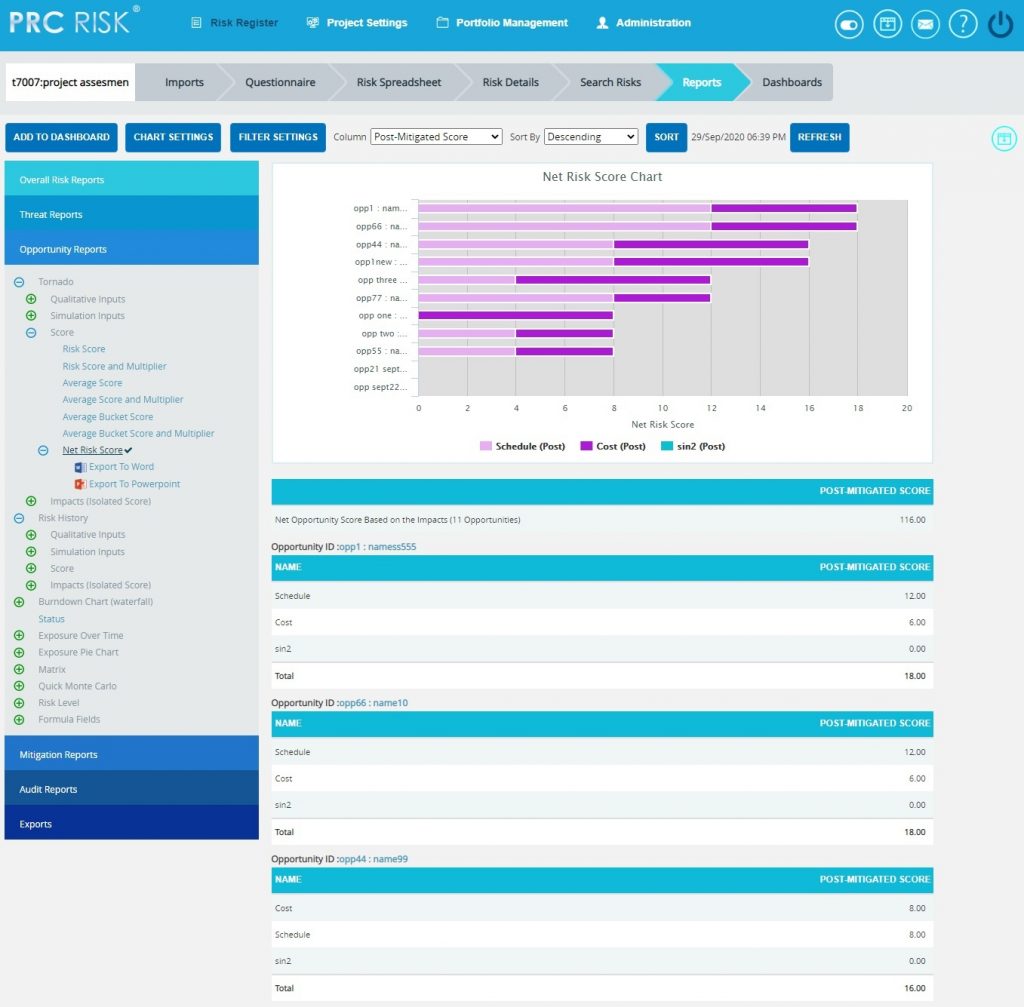
Figure 18
The table below the chart contains each opportunity´s id and name link (Figure 18) that navigates the user to the Risk Details page of that particular opportunity.
Filter:
This functionality is used to apply the Filter to the net risk score chart based on the impact types. It shows all the impacts by default.
Steps:
-
Risk Register —> Reports
-
Click the Opportunity Reports link to select Opportunity Tornado Chart. (Figure 18)
- Click the Net Risk Score link to view the net risk score of each opportunity in the selected project.
- Click the FILTER SETTINGS button. (Figure 19) A pop up shown in Figure appears.
- Select the impacts to be shown with their scores and click the LOAD IMPACT SCORES button. (Figure 19)
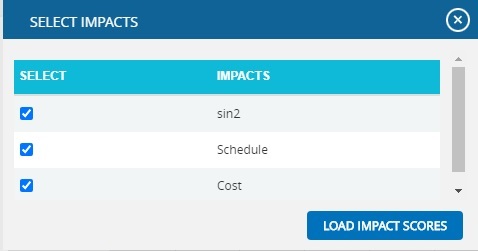
Figure 19
Sort By:
This functionality is used to sort the data for the Net Risk Score chart in ascending or descending order based on the sum of the impact scores.
Steps:
- Risk Register —> Reports
- Click the Opportunity Reports link to select Opportunity Tornado Chart. (Figure 18)
- Click the Net Risk Score link to view the net risk score of each opportunity in the selected project.
- Select the Sort By drop-down to sort the report in ascending or descending order based on the sum of the impact scores. (Figure 18)
- Click the SORT button. (Figure 18)
Refresh:
This functionality is used to refresh the chart with the most recently added opportunity in the project. To refresh the chart, click the REFRESH button. (Figure 18)
Threats Risk History:
The Risk History chart plots a point of time when the corresponding data has changed.
Steps:
-
Risk Register —> Reports
-
Click the Risk History link to select the report as Risk History. (Figure 1)
-
Select Threat Reports link. If the Threat option is selected, the history chart will correspond to the threats in the selected project. (Figure 20)
-
Select Pre-Mitigated to view Pre-Mitigated data only (sorted by Pre-Mitigated), Post-Mitigated to view Post-Mitigated data (sorted by Post-Mitigated) or Both to view both Pre-Mitigated data and Post-Mitigated data from the drop-down. (Figure 20)
-
Click the Risk Score data option or any other data option to generate the report. (Figure 21) The chart generated and the data table is shown in Figure 22.
Opportunity Risk History:
Steps:
-
Risk Register —> Reports
- Click the Risk History link to select the report as Risk History. (Figure 1)
- Select Opportunity Reports link. If the Opportunity option is selected, the history chart will correspond to the Opportunity in the selected project. (Figure 20)
- Select Pre-Mitigated to view Pre-Mitigated data only (sorted by Pre-Mitigated), Post-Mitigated to view Post-Mitigated data (sorted by Post-Mitigated) or Both to view both Pre-Mitigated data and Post-Mitigated data from the drop-down. (Figure 20)
- Click the Risk Score data option or any other data option to generate the report. (Figure 21) The chart generated and the data table is shown in Figure 23.

Figure 20
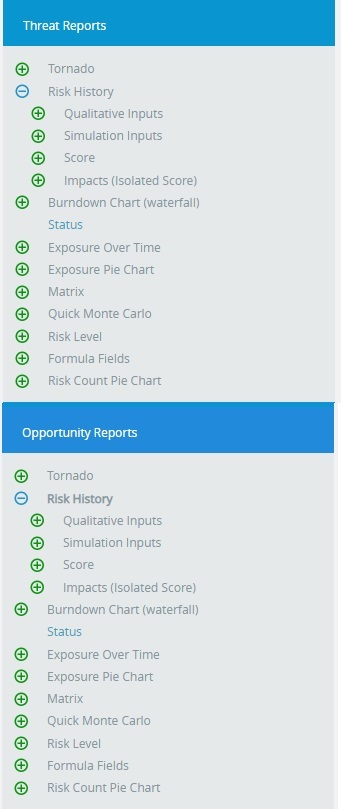
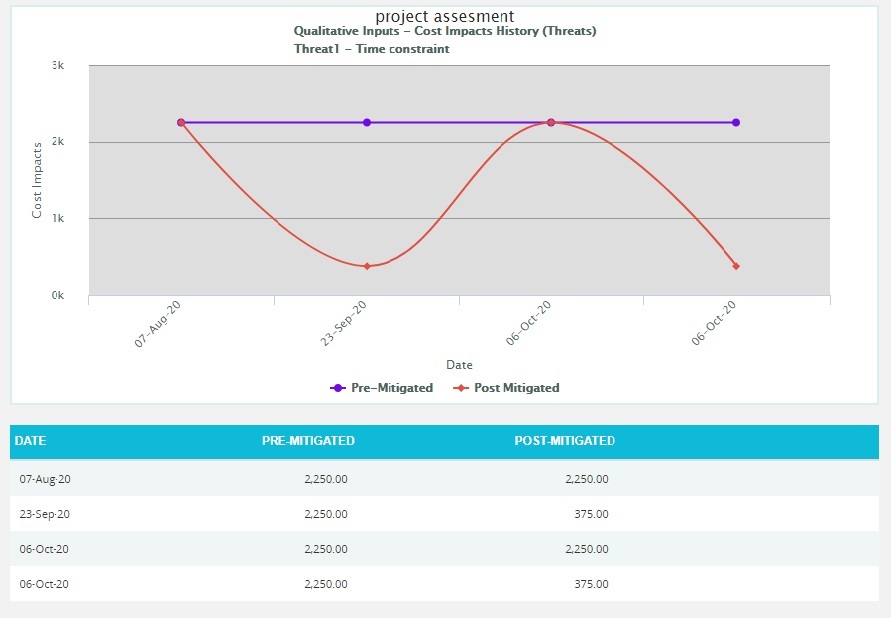
Figure 22
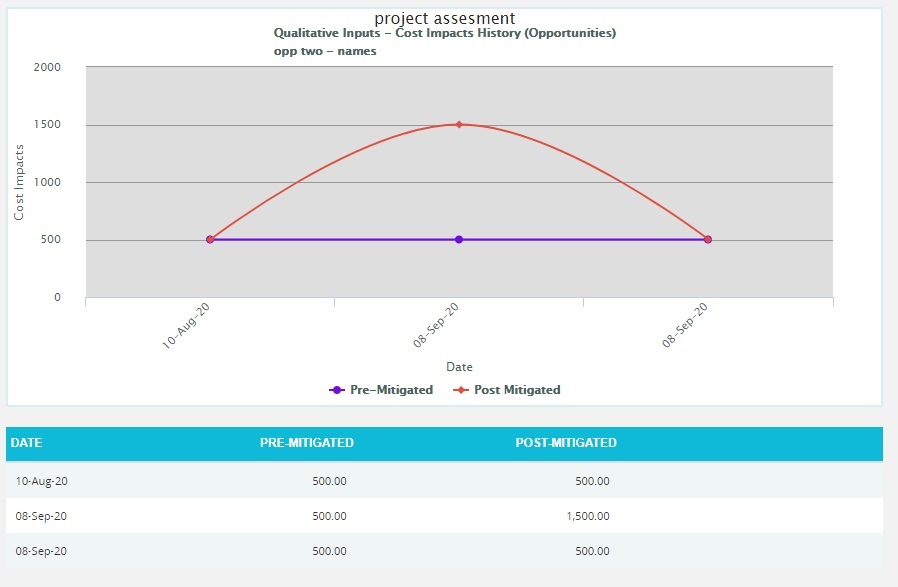
Figure 23
Status:
The Status chart is represented by a pie chart and corresponds to the status assigned to the risk.
Steps:
-
Risk Register —> Reports
-
Click the Status link to select the report Status. (Figure 1)
-
Click the FILTER SETTINGS button to add a filter. (Steps to be followed to add a filter are explained in filter section above) (Figure 10)
-
Click the Status —> Threat Status link under Threat reports to know the status of threats in the selected project. Click the Status —> Opportunity Status link under Opportunity reports to know the status of opportunity in the selected project. To know the status of mitigations in the selected project, click Status —> Mitigation Status link. Click the Threat and Opportunity Status or Total Threats and Opportunities link under Over all Risk Reports to know the status of threats and opportunities in the selected project. (Figure 24) The chart generated and the data tables are shown in Figure 25 and Figure 26.
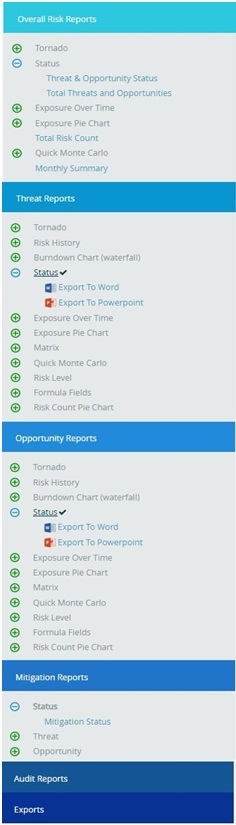
Figure 24
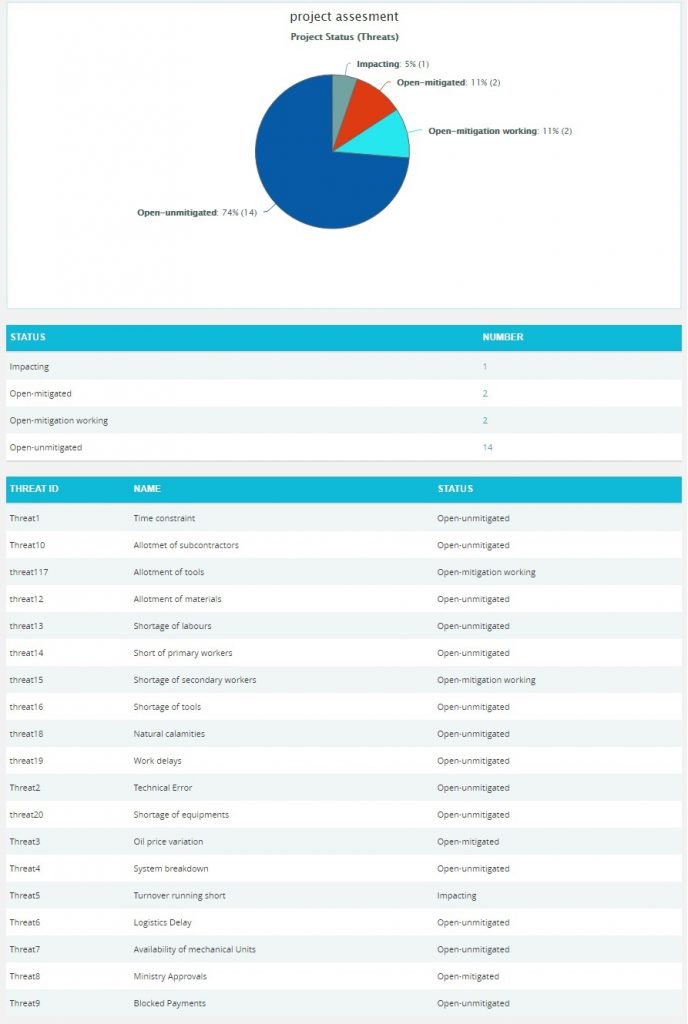
Figure 25
The count under the Number column shown in Figure 25 has a link to the Risk Score Tornado (Threats) Chart. (Figure 13)
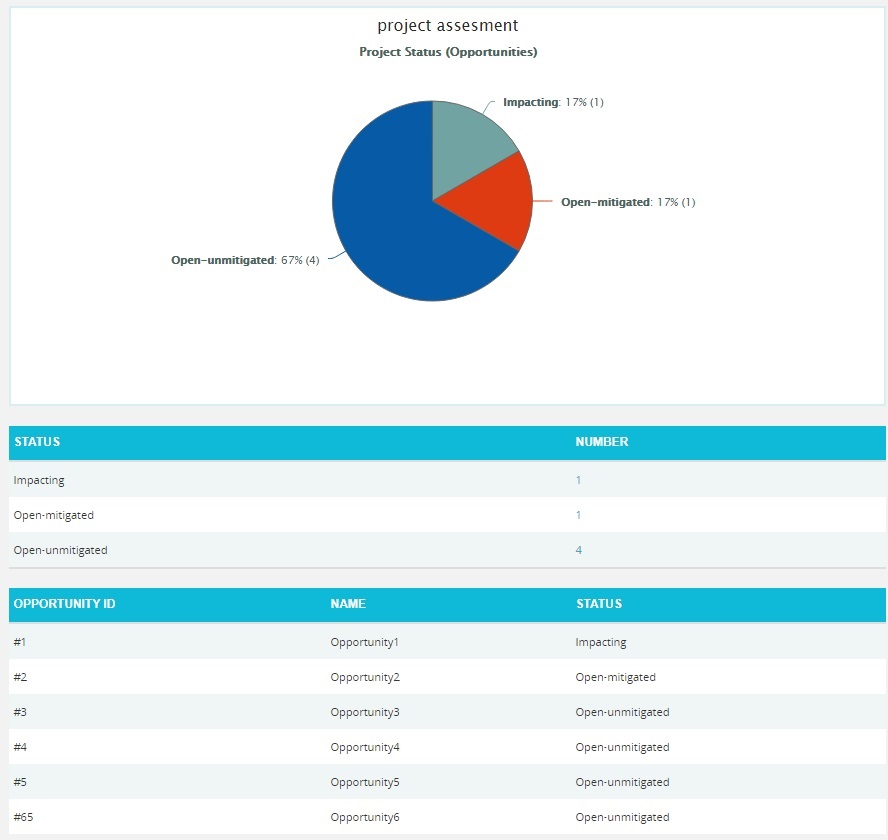
Figure 26
The count under the Number column shown in Figure 26 has a link to the Risk Score Tornado (Threats) Chart. (Figure 17)
Burndown Chart (Waterfall):
The Burndown charts are plotted based on Threat Start/Finish dates and Mitigation Actual and Proposed dates. The first value used to plot the chart is the Risk Start Date.
Steps:
-
Risk Register —> Reports
-
Click the Burndown Chart (waterfall) link to select the report Burndown Chart. (Figure 1)
-
Select Threat or Opportunity Reports link. If the Threat option is selected, the history chart will correspond to the threats in the selected project. If the Opportunity option is selected, the history chart will correspond to the Opportunity in the selected project. (Figure 27)
-
Click the Risk Score link or any other data option to generate the report for each risk. (Figure 28) The chart generated and the data table is shown in Figure 29.
- Select any Threat/Opportunity from the Select Risk drop-down. (Figure 27)
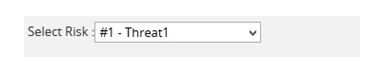
Figure 27
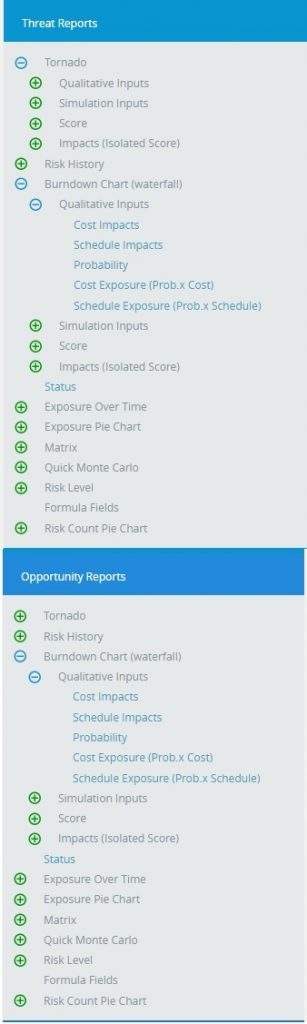
Figure 28
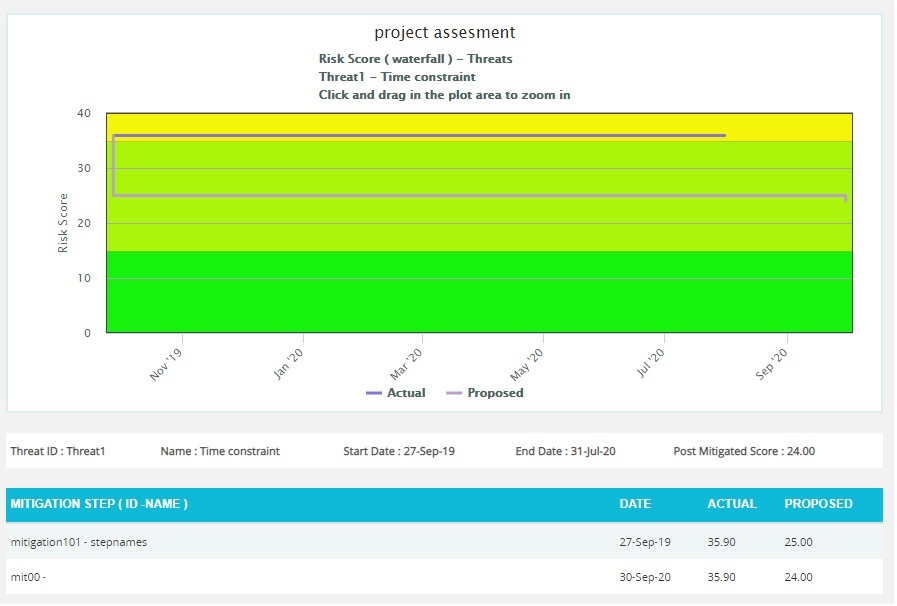
Figure 29
Threat Exposure Over Time:
The Threat Exposure Over Time chart is generated based on the Qualitative Cost Exposure, Simulation Cost Exposure, Qualitative Schedule Exposure and Simulation Schedule Exposure for all the threats in the selected project.
Steps:
-
Risk Register —> Reports
-
Click the Exposure Over Time link under Threat Reports. (Figure 1)
-
Select Pre-Mitigated to view Pre-Mitigated data only (sorted by Pre-Mitigated), Post-Mitigated to view Post-Mitigated data (sorted by Post-Mitigated) or Both to view both Pre-Mitigated data and Post-Mitigated data from the drop-down. (Figure 10)
-
Click the FILTER SETTINGS button to add a filter. (Steps to be followed to add a filter are explained in filter section above) (Figure 10)
-
Click the Cost Under Simulation link or any other data option to generate the report. (Figure 30) The chart generated and the data table is shown in Figure 31.
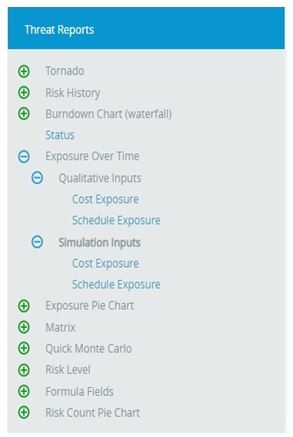
Figure 30
![]()
Figure 31
The Column Date of the data table (Figure 31) contains a link that navigates the user to the following charts:
- Simulation Cost Exposure Tornado (Threat), if the option Cost Under Simulation For Threat Reports is selected.
- Qualitative Cost Exposure Tornado (Threat), if the option Cost Under Qualitative For Threat Reports is selected.
- Simulation Schedule Exposure Tornado (Threat), if the option Schedule Under Simulation For Threat Reports is selected.
- Qualitative Schedule Exposure Tornado (Threat), if the option Schedule Under Qualitative For Threat Reports is selected
Opportunity Exposure Over Time:
The Opportunity Exposure Over Time chart is generated based on the Qualitative Cost Exposure, Simulation Cost Exposure, Qualitative Schedule Exposure and Simulation Schedule Exposure for all the opportunities in the selected project.
Steps:
-
Risk Register —> Reports
-
Click the Exposure Over Time link under Opportunity Reports. (Figure 1)
- Select Pre-Mitigated to view Pre-Mitigated data only (sorted by Pre-Mitigated), Post-Mitigated to view Post-Mitigated data (sorted by Post-Mitigated) or both to view both Pre-Mitigated data and Post-Mitigated data from the drop-down. (Figure 10)
- Click the FILTER SETTINGS button to add a filter. (Steps to be followed to add a filter are explained in filter section above) (Figure 10)
- Click the Cost Under Simulation link or any other data option to generate the report. (Figure 32) The chart generated and the data table is shown in Figure 33.
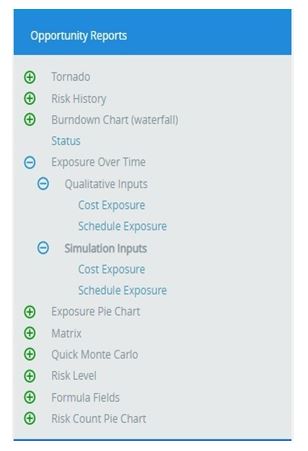
Figure 32
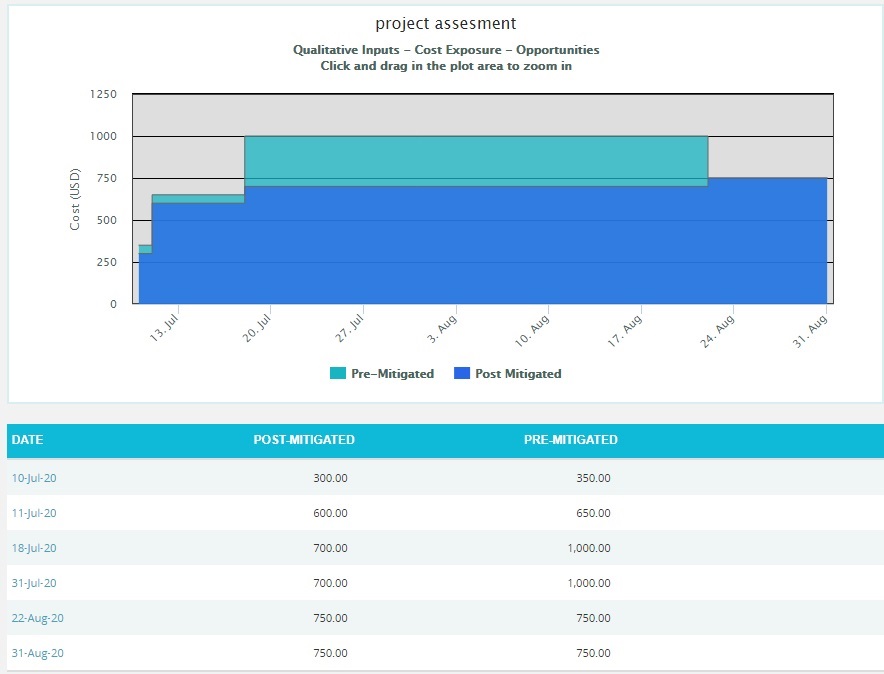
Figure 33
The Column Date of the data table (Figure 33) contains a link that navigates the user to the following charts:
- Simulation Cost Exposure Tornado (Opportunities), if the option Cost Under Simulation For Opportunity Reportsis selected.
- Qualitative Cost Exposure Tornado (Opportunities), if the option Cost Under Qualitative For Opportunity Reports is selected.
- Simulation Schedule Exposure Tornado (Opportunities), if the option Schedule Under Simulation For Opportunity Reportsis selected.
- Qualitative Schedule Exposure Tornado (Opportunities), if the option Schedule Under Qualitative For Opportunity Reports is selected.
Threat Simulation Exposure Pie Chart:
The Threat Simulation Exposure Pie Chart depends on the simulation cost exposure of the threats mapped to the breakdown structure in the selected project.
Steps:
-
Risk Register —> Reports
-
Click the Exposure Pie Chart link under Threat Reports. (Figure 1)
-
Select Pre-Mitigated to view Pre-Mitigated data only (sorted by Pre-Mitigated), Post-Mitigated to view Post-Mitigated data (sorted by Post-Mitigated) from the dropdown. (Figure 10)
-
Click the FILTER SETTINGS button to add a filter. (Steps to be followed to add a filter are explained in filter section above) (Figure 10)
-
Click the Project-WBS link or any other data option to generate the report. (Figure 34) The chart generated and the data table is shown in Figure 35.
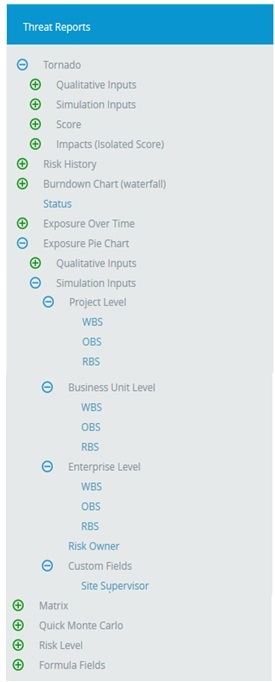
Figure 34
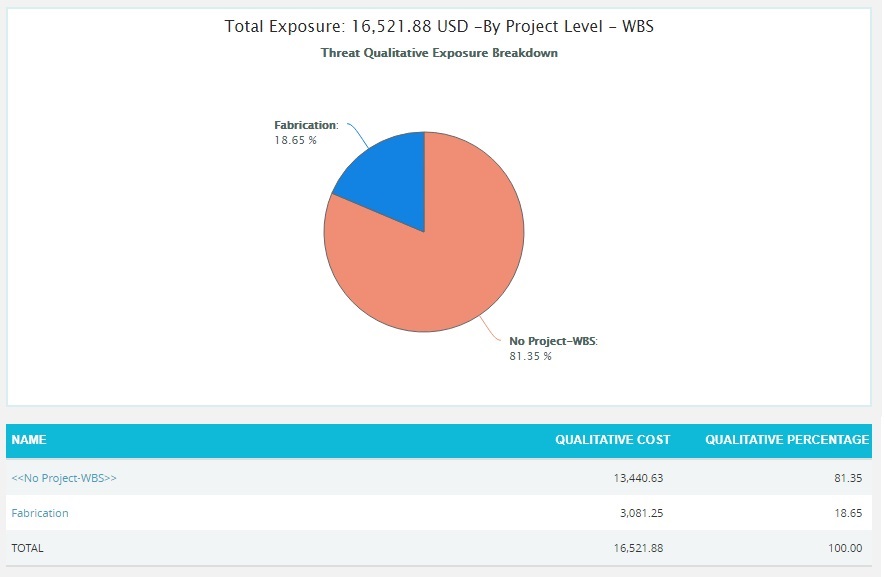
Figure 35
The Name column contains a link to WBS Tornado (Threats). (Figure 35)
Opportunity Simulation Exposure Pie Chart:
The Opportunity Simulation Exposure Pie Chart depends on the simulation cost exposure of the opportunities mapped to the break down structure in the selected project.
Steps:
-
Risk Register —> Reports
-
Click the Exposure Pie Chart link under Opportunity Reports. (Figure 1)
-
Select Pre-Mitigated to view Pre-Mitigated data only (sorted by Pre-Mitigated), Post-Mitigated to view Post-Mitigated data (sorted by Post-Mitigated) from the dropdown. (Figure 10)
- Click the FILTER SETTINGS button to add a filter. (Steps to be followed to add a filter are explained in filter section above) (Figure 10)
- Click the Project-WBS link or any other data option to generate the report. (Figure 36) The chart generated and the data table is shown in Figure 37.
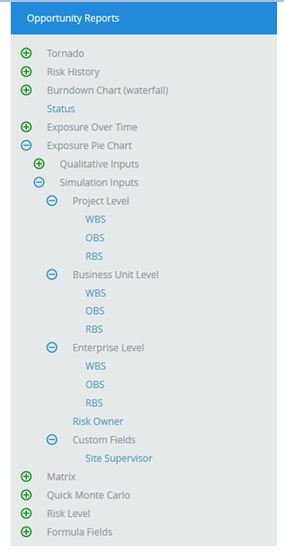
Figure 36
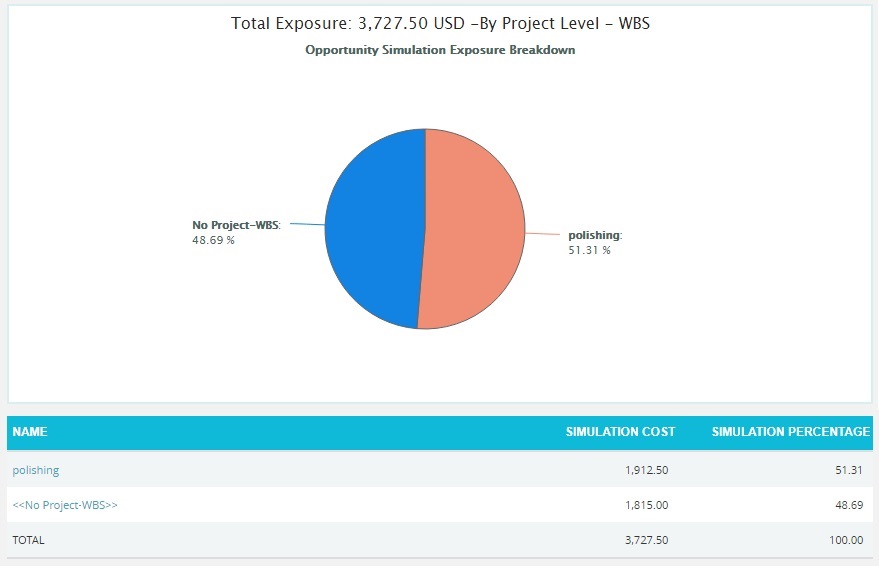
Figure 37
The Name column contains a link to WBS Tornado (Opportunities). (Figure 37)
Threat Qualitative Exposure Pie Chart:
The Threat Qualitative Exposure Pie Chart depends on the simulation cost exposure of the threats mapped to the breakdown structure in the selected project.
Steps:
-
Risk Register —> Reports
-
Click the Exposure Pie Chart link under Threat Reports. (Figure 1)
- Select Pre-Mitigated to view Pre-Mitigated data only (sorted by Pre-Mitigated), Post-Mitigated to view Post-Mitigated data (sorted by Post-Mitigated) from the dropdown. (Figure 10)
- Click the FILTER SETTINGS button to add a filter. (Steps to be followed to add a filter are explained in the filter section above) (Figure 10)
- Click the Project-WBS link or any other data option to generate the report. (Figure 38) The chart generated and the data table is shown in Figure 39.
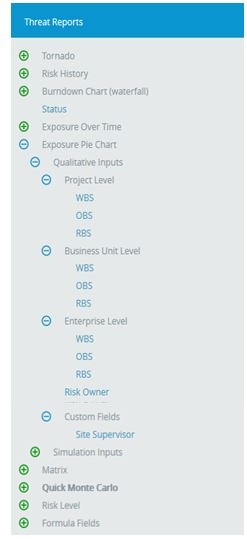
Figure 38
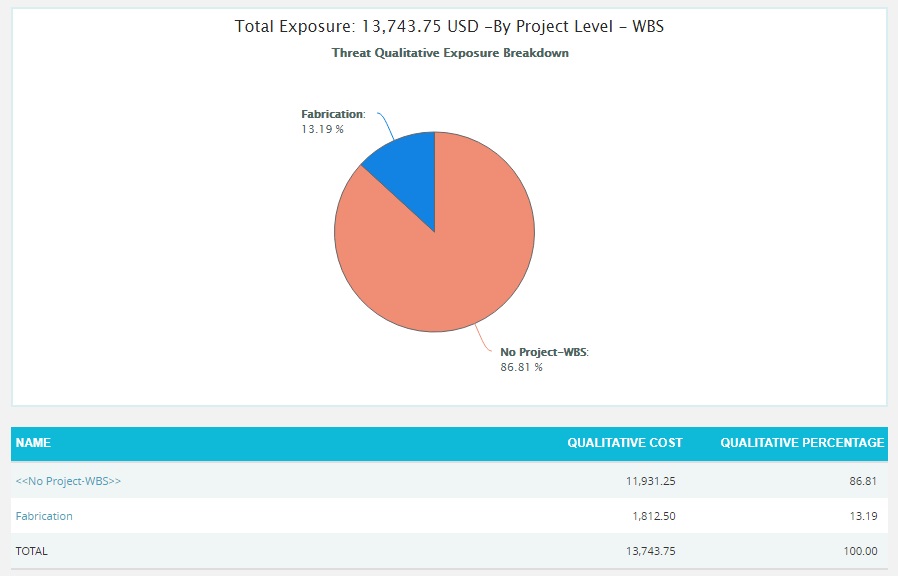
Figure 39
The Name column contains a link to WBS Tornado (Threats). (Figure 39)
Opportunity Qualitative Exposure Pie Chart:
The Opportunity Qualitative Exposure Pie Chart depends on the simulation cost exposure of the opportunities mapped to the break down structure in the selected project.
Steps:
-
Risk Register —> Reports
-
Click the Exposure Pie Chart link under Opportunity Reports. (Figure 1)
-
Select Pre-Mitigated to view Pre-Mitigated data only (sorted by Pre-Mitigated), Post-Mitigated to view Post-Mitigated data (sorted by Post-Mitigated) from the dropdown. (Figure 10)
-
Click the FILTER SETTINGS button to add a filter. (Steps to be followed to add a filter are explained in filter section above) (Figure 10)
-
Click the Project-WBS link or any other data option to generate the report. (Figure 40) The chart generated and the data table is shown in Figure 41.
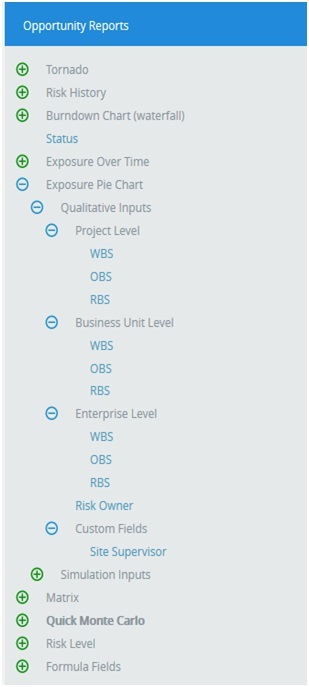
Figure 40
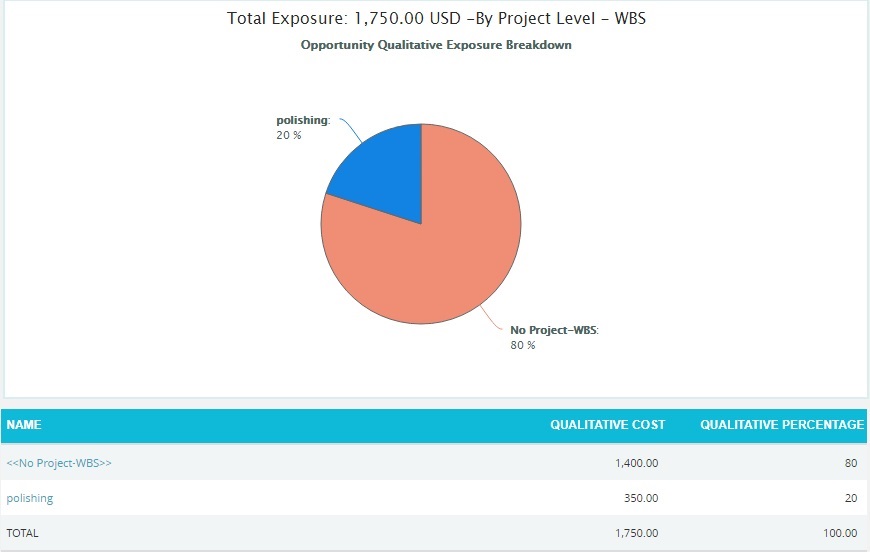
Figure 41
The Name column contains a link to WBS Tornado (Threats). (Figure 41)
Matrix Chart:
Threat Score Matrix:
The Threat Score Matrix page provides a summary of all the Threats in the project on the basis of probability and impacts. The details of those Threats whose Risk Score is 0 will not be displayed in this chart.
- The Pre-Mitigated Risks section shows the Pre-Mitigated risk score of all the threats in the project. For example, 12(3) indicates that 3 threats has a Pre-Mitigated score of 12.
- The Post-Mitigated Risks section shows the Post-Mitigated risk score of all the threats in the project. For example, 12(3) indicates that 3 threats has a Post-Mitigated score of 12.
The color is given based on the color that has been set for the probability and impact scale in the Project Settings Threat Scoring system.
Steps:
-
Risk Register —> Reports
-
Click the Matrix link under Threat Reports. (Figure 1)
-
Click the FILTER SETTINGS button to add a filter. (Steps to be followed to add a filter are explained in filter section above) (Figure 10)
-
Click the Threat Score Matrix link. (Figure 42) The chart generated and the data table is shown in Figure 42.
- Click REFRESH button to refresh the chart. (Figure 42)
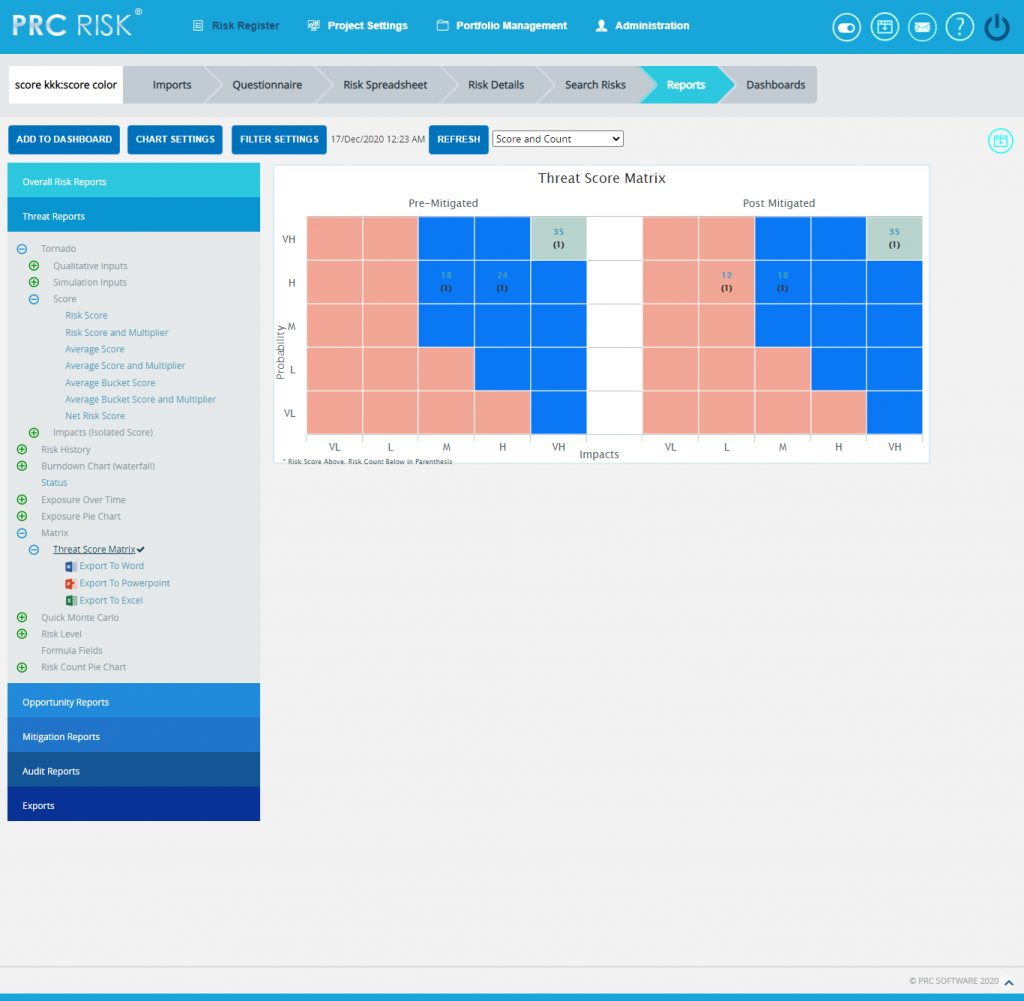
Figure 42
Opportunity Score Matrix:
The Opportunity Score Matrix page provides a summary of all the Opportunities in the project on the basis of probability and impacts. The details of those Opportunities whose Risk Score is 0 will not be displayed in this chart.
- The Pre-Mitigated Risks section shows the Pre-Mitigated risk score of all the opportunities in the project. For example, 12(3) indicates that 3 opportunities has a Pre-Mitigated score of 12.
- The Post-Mitigated Risks section shows the Post-Mitigated risk score of all the opportunities in the project. For example, 12(3) indicates that 3 opportunities has a Post-Mitigated score of 12.
The color is given based on the color that has been set for the probability and impact scale in the Project Settings Opportunity Scoring system.
Steps:
-
Risk Register —> Reports
-
Click the Matrix link under Threat Reports. (Figure 1)
-
Click the FILTER SETTINGS button to add a filter. (Steps to be followed to add a filter are explained in filter section above). (Figure 10)
-
Click the Threat Score Matrix link. (Figure 43) The chart generated and the data table is shown in Figure 43.
- Click REFRESH button to refresh the chart. (Figure 43)
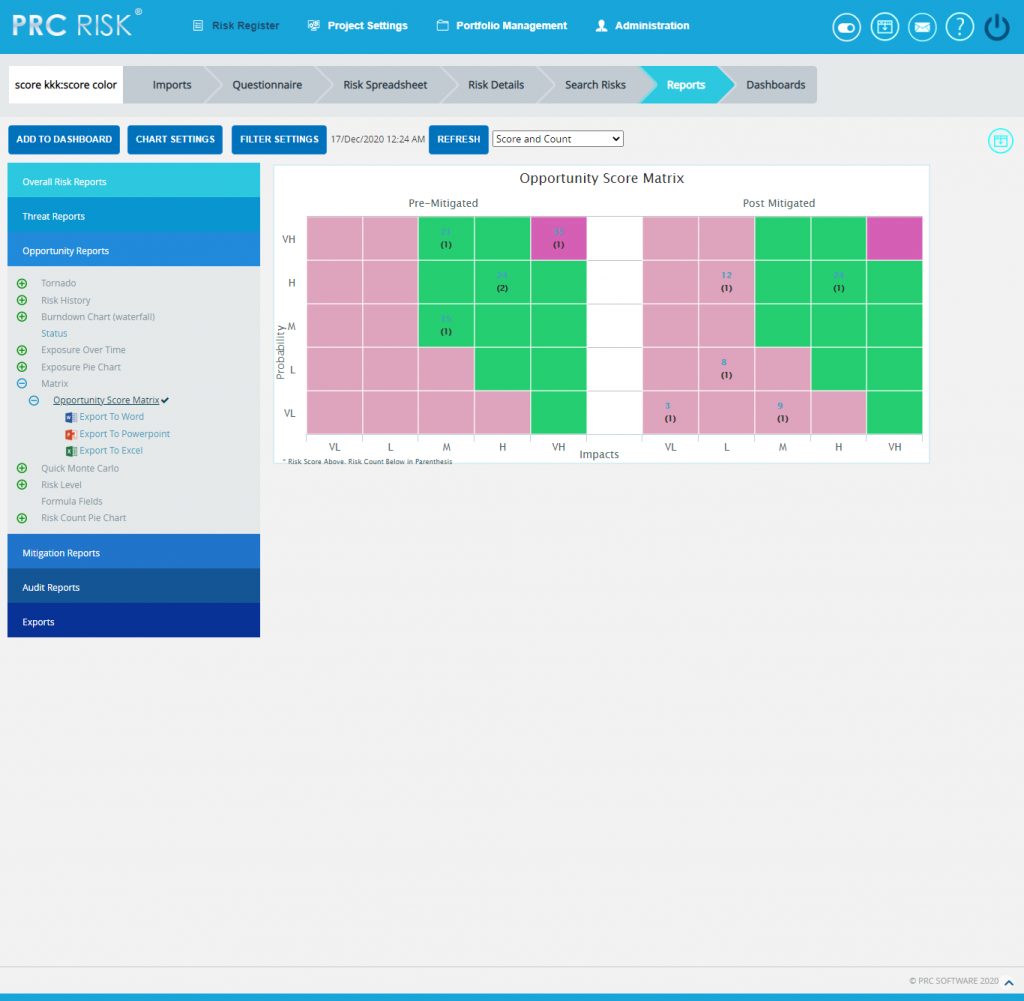
Figure 43
Quick Monte Carlo:
Cost Cumulative S Curve:
The Cost Cumulative S Curve report shows the distribution of the Cost Exposure of a selected project. It simulates cost values using Triangular Distribution. The columns show the hits for each of the total amount of risk cost exposure. The S curve shows the cumulative frequency of the hits in percentage.
Steps:
- Risk Register —> Reports
- Click the Quick Monte Carlo link under Threat / Opportunity Reports. (Figure 1)
- Click the Cost Cumulative S Curve link. (Figure 44) The chart generated and the data table is shown in Figure 44.
- Click the FILTER SETTINGS button. Cost Analysis Inputs pop up appears where the Iteration number, Highlights, Pre-Mitigated options (Figure 45.1) and Post-mitigated options (Figure 45.2) are given based on which the Cumulative Frequency iterations and the Cumulative percentage values to be highlighted are shown in the chart and table.
- Click the RUN ANALYSIS AND SHOW REPORT button to view the filtered report for Pre-Mitigated and Post-mitigated options (Figure 45.1 and Figure 45.2)
- Click REFRESH button to refresh the chart. (Figure 44)
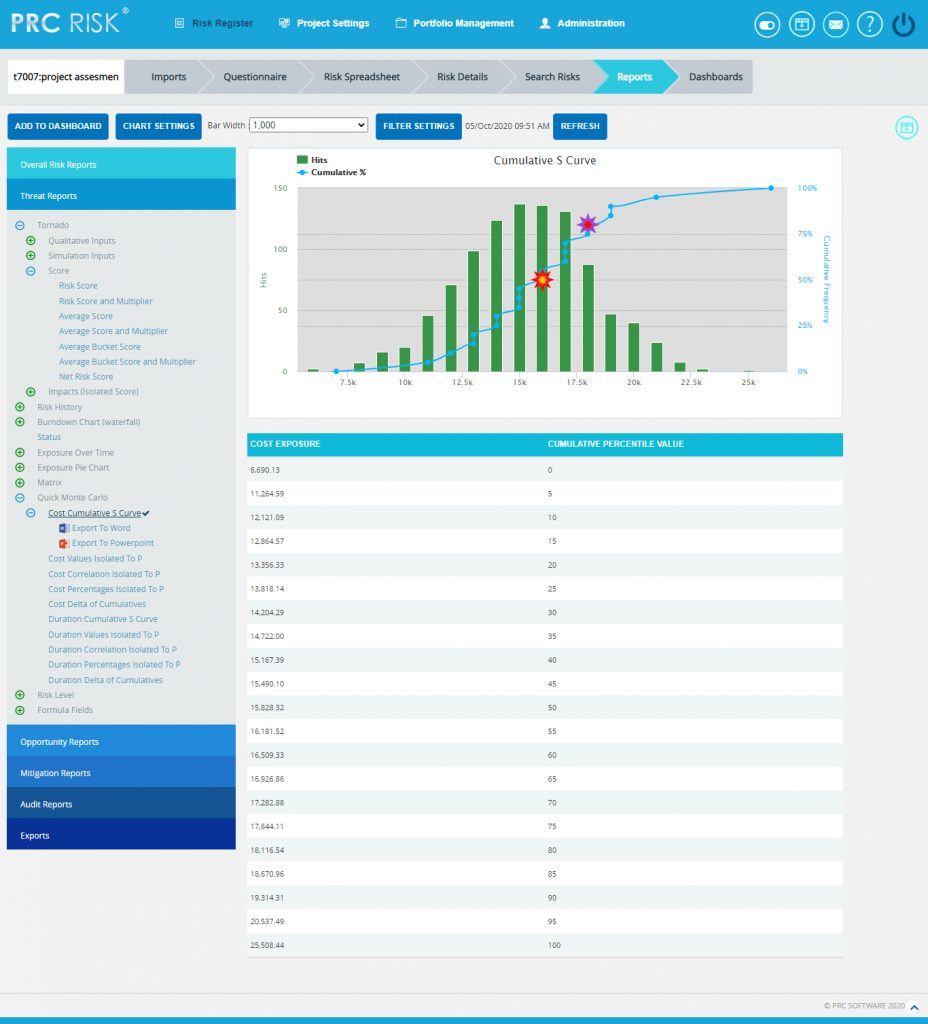
Figure 44

Figure 45.1
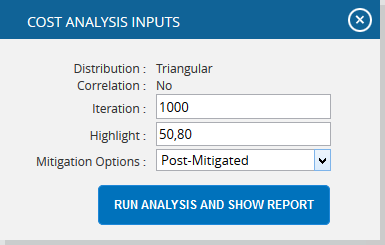
Figure 45.2
Top Risk Reports:
The Top Risk reports are Tornado Charts that depends on the simulated cost exposure values of each risk up to the Pn iteration value, where `n´ is the percentile value of total number of iterations given. The Top Risk reports include Cost Values Isolated to P and Cost Percentages Isolated to P reports. The x axis represents the cost exposure and the y axis represents the top risk names. Cost Exposure is the qualitative cost multiplied by probability percentage.
Steps:
- Risk Register —> Reports
- Click the Quick Monte Carlo link under Threat / Opportunity Reports. (Figure 1)
- Click the Cost Values Isolated to P / Cost Percentages Isolated to P link. (Figure 46) The chart generated and the data table is shown in Figure 46.
- Click the FILTER SETTINGS button. Cost Analysis Inputs pop up appears where the Cumulative Frequency iteration number is given based on which the iterations are shown in the chart and in the table. (Figure 47.1 and Figure 47.2)
- Click the RUN ANALYSIS AND SHOW REPORT button to view the filtered report Pre-Mitigated and Post-mitigated options. (Figure 47.1 and Figure 47.2)
- Click REFRESH button to refresh the chart. (Figure 46)
![]()
Figure 46
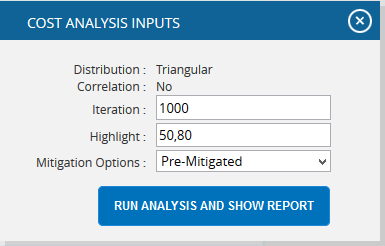
Figure 47.1
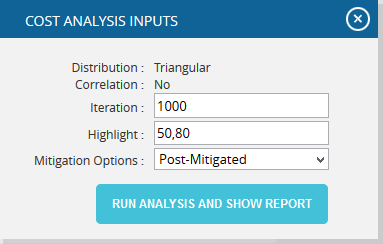
Figure 47.2
Cost Delta of Cumulatives:
The Cost Delta of Cumulatives report shows the distribution difference between the pre cost exposure and post cost exposure of a selected project. It simulates cost values using triangular distribution. The S curve shows the cumulative frequency of the hits in percentage.
Steps:
- Risk Register –> Reports
- Click the Quick Monte Carlo link under Threat / Opportunity Reports. (Figure 1)
- Click the Cost Delta of Cumulatives (Figure 48) The chart generated and the data table is shown in Figure 48.
- Click the FILTER SETTINGS Cost Analysis Inputs pop up appears where the Iteration number and Highlights (Figure 49) are given based on which the Cumulative Frequency iterations and the Cumulative percentage values to be highlighted are shown in the chart and table.
- Click the RUN ANALYSIS AND SHOW REPORT button to view the filtered report. (Figure 49)
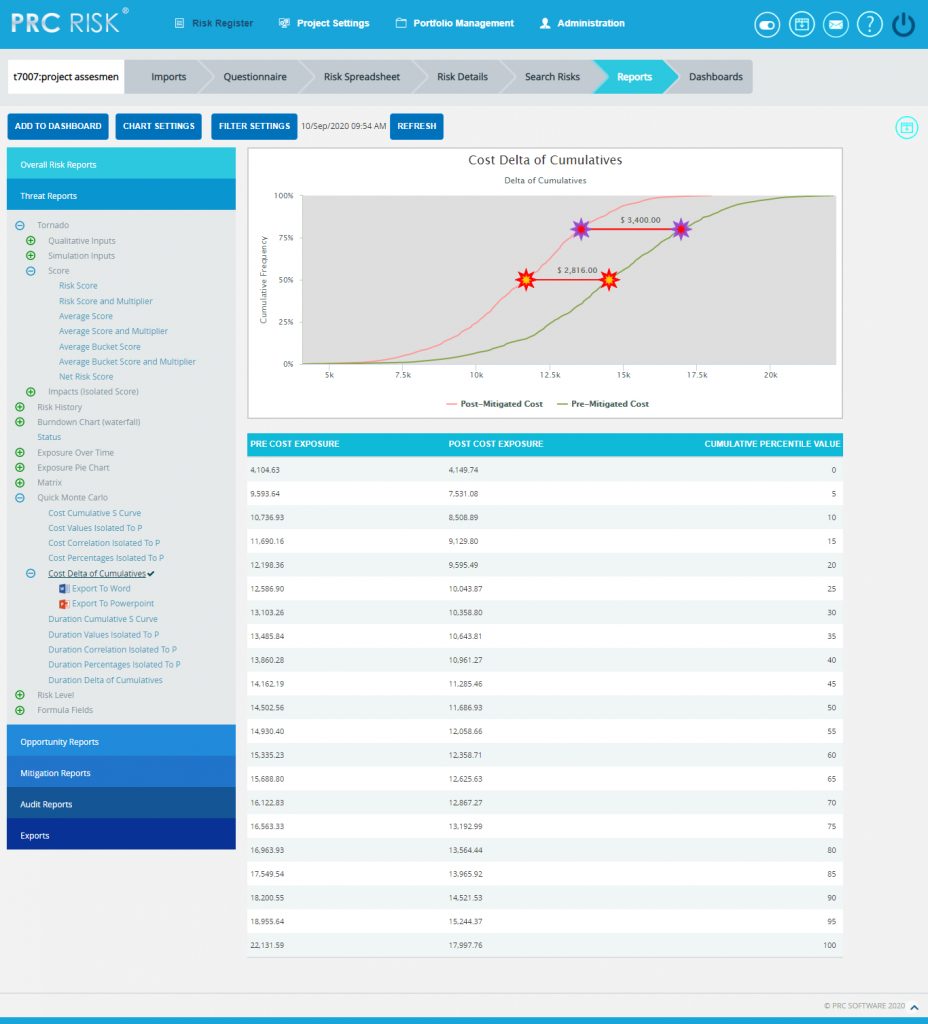
Figure 48
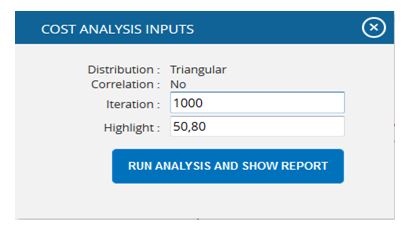
Figure 49
Duration Cumulative S Curve:
The Duration Cumulative S Curve report shows the distribution of the Duration Exposure of a selected project. It simulates duration values using Triangular Distribution. The columns show the hits for each of the total amount of risk duration exposure. The S curve shows the cumulative frequency of the hits in percentage.
Steps:
- Risk Register —> Reports
- Click the Quick Monte Carlo link under Threat / Opportunity Reports. (Figure 1)
- Click the Duration Cumulative S Curve link. (Figure 50) The chart generated and the data table is shown in Figure 50.
- Click the FILTER SETTINGS button. Cost Analysis Inputs pop up appears where the Iteration number, Highlights, Pre-Mitigated options (Figure 51.1) and Post-mitigated options (Figure 51.2) are given based on which the Cumulative Frequency iterations and the Cumulative percentage values to be highlighted are shown in the chart and table.
- Click the RUN ANALYSIS AND SHOW REPORT button to view the filtered report. (Figure 51.1 and Figure 51.2)
- Click REFRESH button to refresh the chart. (Figure 50)
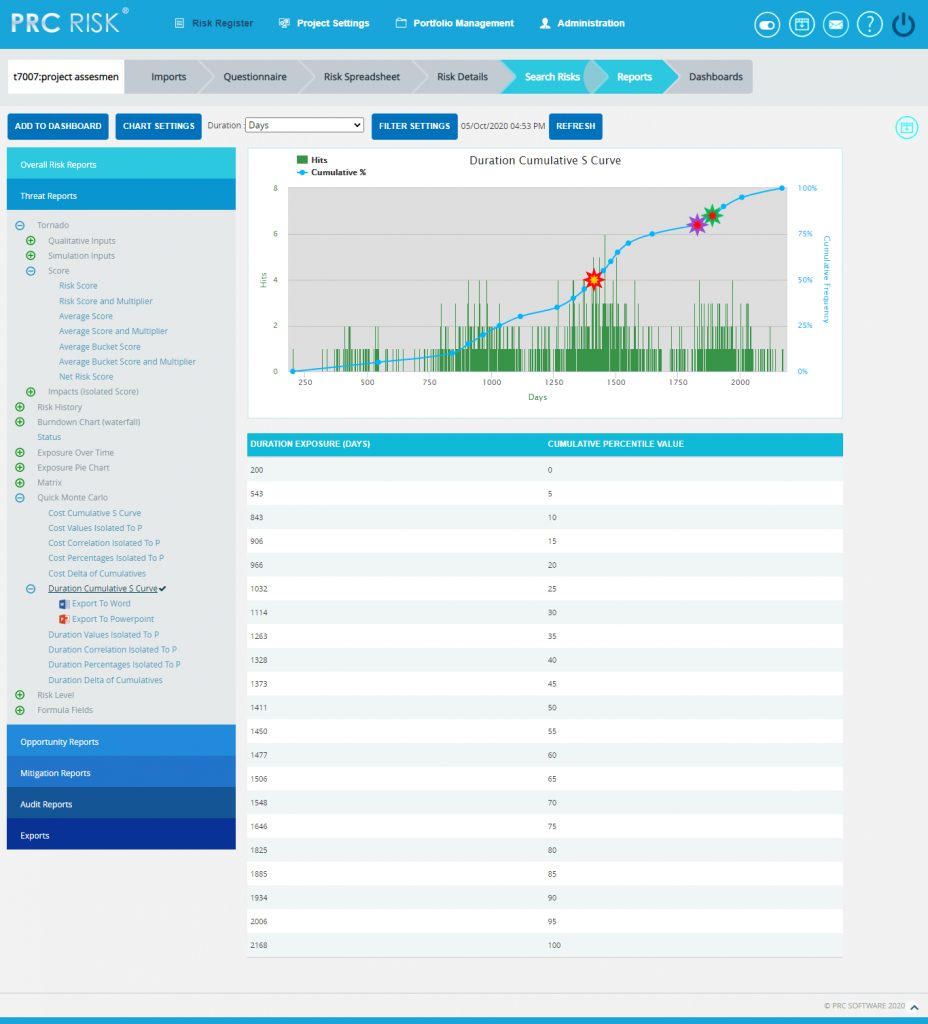
Figure 50
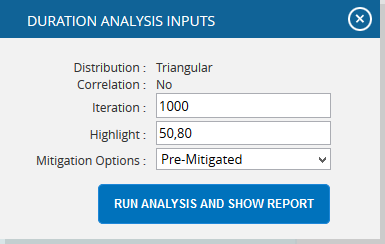
Figure 51.1
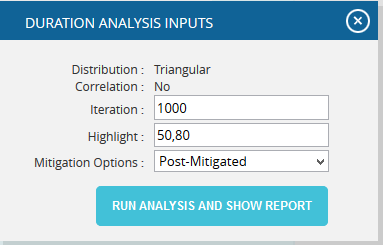
Figure 51.2
Top Risk Reports:
The Top Risk reports are Tornado Charts that depends on the simulated duration exposure values of each risk up to the Pn iteration value, where `n´ is the percentile value of total number of iterations given. The Top Risk reports include Duration Values Isolated to P and Duration Percentages Isolated to P reports. The x axis represents the duration exposure and the y axis represents the top risk names. Duration Exposure is the qualitative duration multiplied by probability percentage.
Steps:
- Risk Register –> Reports
- Click the Quick Monte Carlo link under Threat / Opportunity Reports. (Figure 1)
- Click the Duration Values Isolated to P / Duration Percentages Isolated to P link. (Figure 52) The chart generated and the data table is shown in Figure 52.
- Click the FILTER SETTINGS button. Duration Analysis Inputs pop up appears where the Cumulative Frequency iteration number is given based on which the iterations are shown in the chart and in the table. (Figure 53.1 and Figure 53.2)
- Click the RUN ANALYSIS AND SHOW REPORT button to view the filtered report. (Figure 53.1 and Figure 53.2)
- Click REFRESH button to refresh the chart. (Figure 52)
![]()
Figure 52

Figure 53.1

Figure 53.2
Duration Delta of Cumulatives:
The Duration Delta of Cumulatives report shows the distribution difference between the pre Duration exposure and post Duration exposure of a selected project. It simulates Duration values using triangular distribution. The S curve shows the cumulative frequency of the hits in percentage.
Steps:
- Risk Register –> Reports
- Click the Quick Monte Carlo link under Threat / Opportunity Reports. (Figure 1)
- Click the Duration Delta of Cumulatives (Figure 54) The chart generated and the data table is shown in Figure 54.
- Click the FILTER SETTINGS Duration Analysis Inputs pop up appears where the Iteration number and Highlights (Figure 55) are given based on which the Cumulative Frequency iterations and the Cumulative percentage values to be highlighted are shown in the chart and table.
- Click the RUN ANALYSIS AND SHOW REPORT button to view the filtered report. (Figure 55)
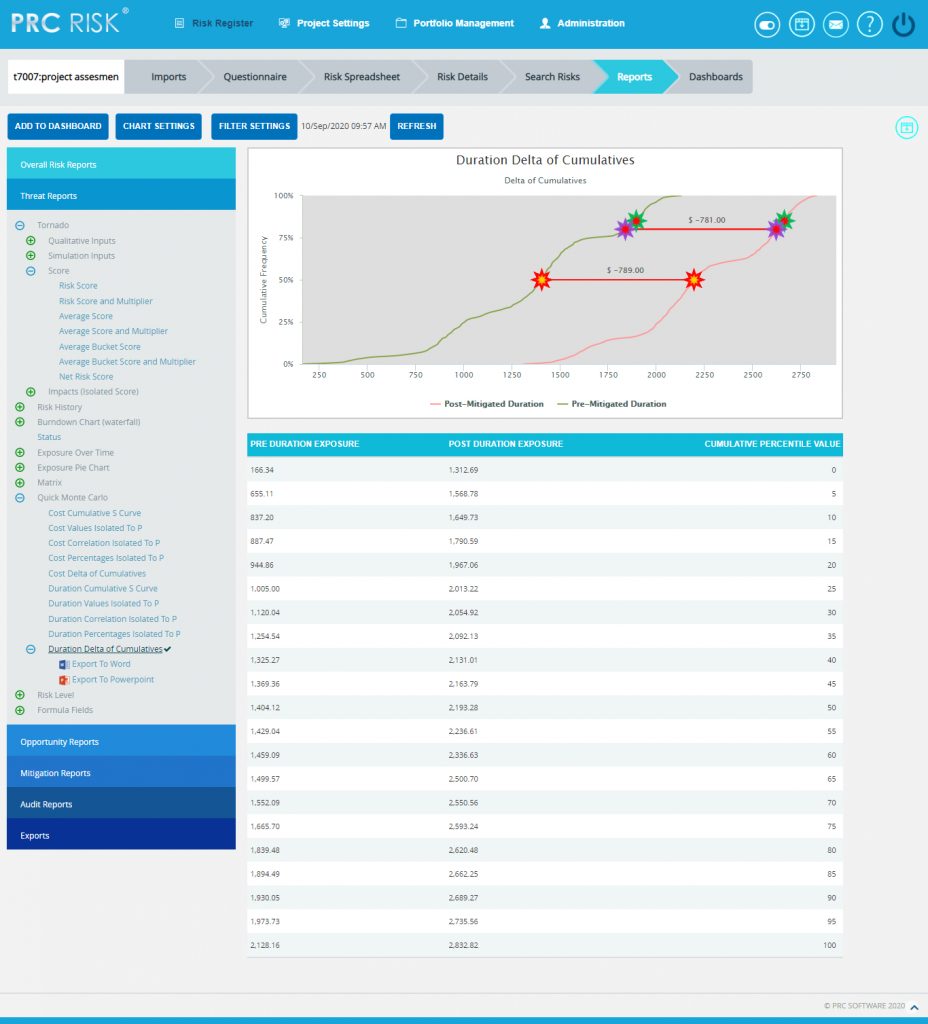
Figure 54
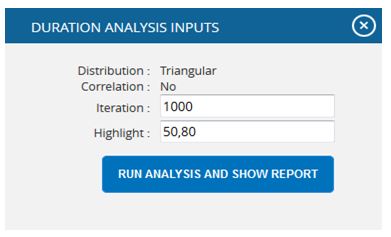
Figure 55
Risk Level Reports:
The Risk Level reports are Pie Charts which show the number of risks mapped to each impact level or probability level.
Steps:
- Risk Register -> Reports
- Select any of the reports under Risk Level option. (Figure 56) The chart generated and the data table is shown in Figure 57.
Figure 56
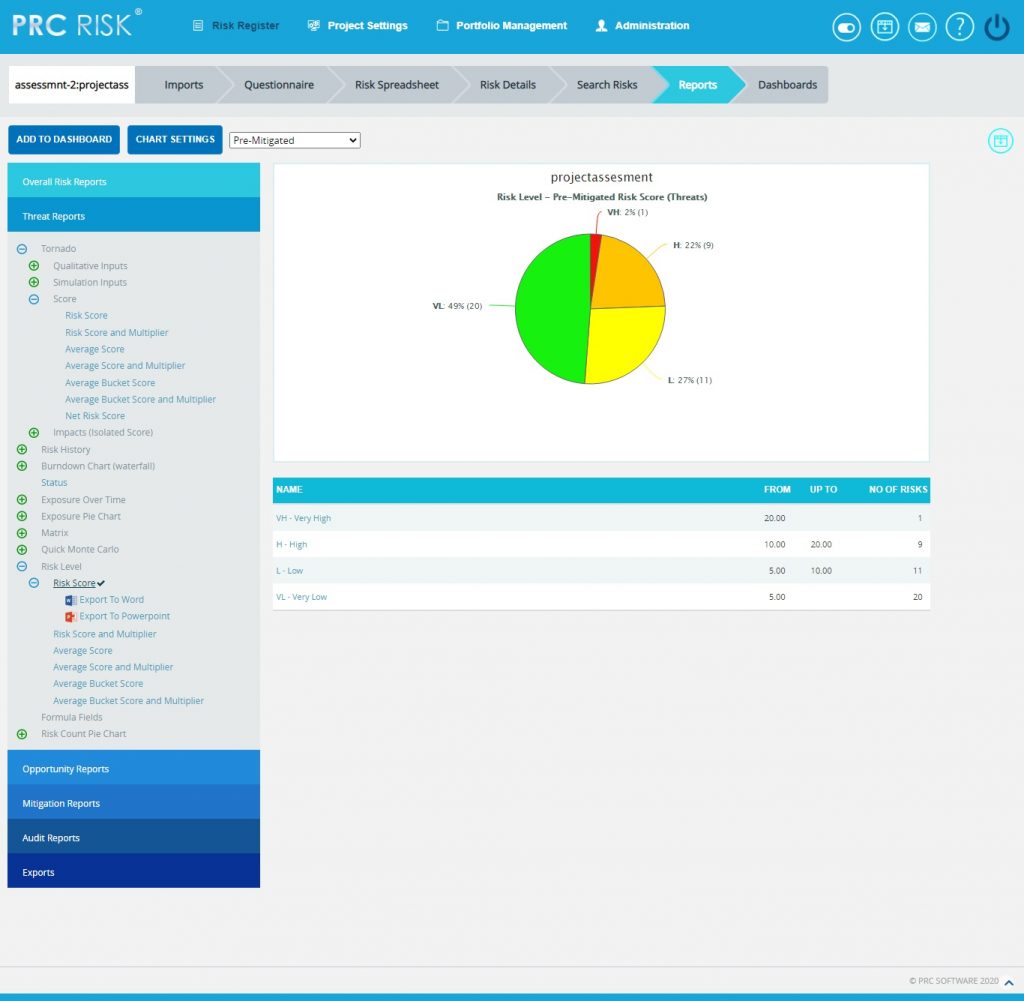
Figure 57
Formula Field Reports:
These reports are generated corresponding to the user defined formula field values added or imported under Project Settings-> Custom Fields->Formula Field.
Steps:
- Risk Register —> Reports
- Select any of the reports under Formula Fields option. The chart generated and the data table is shown in Figure 58.
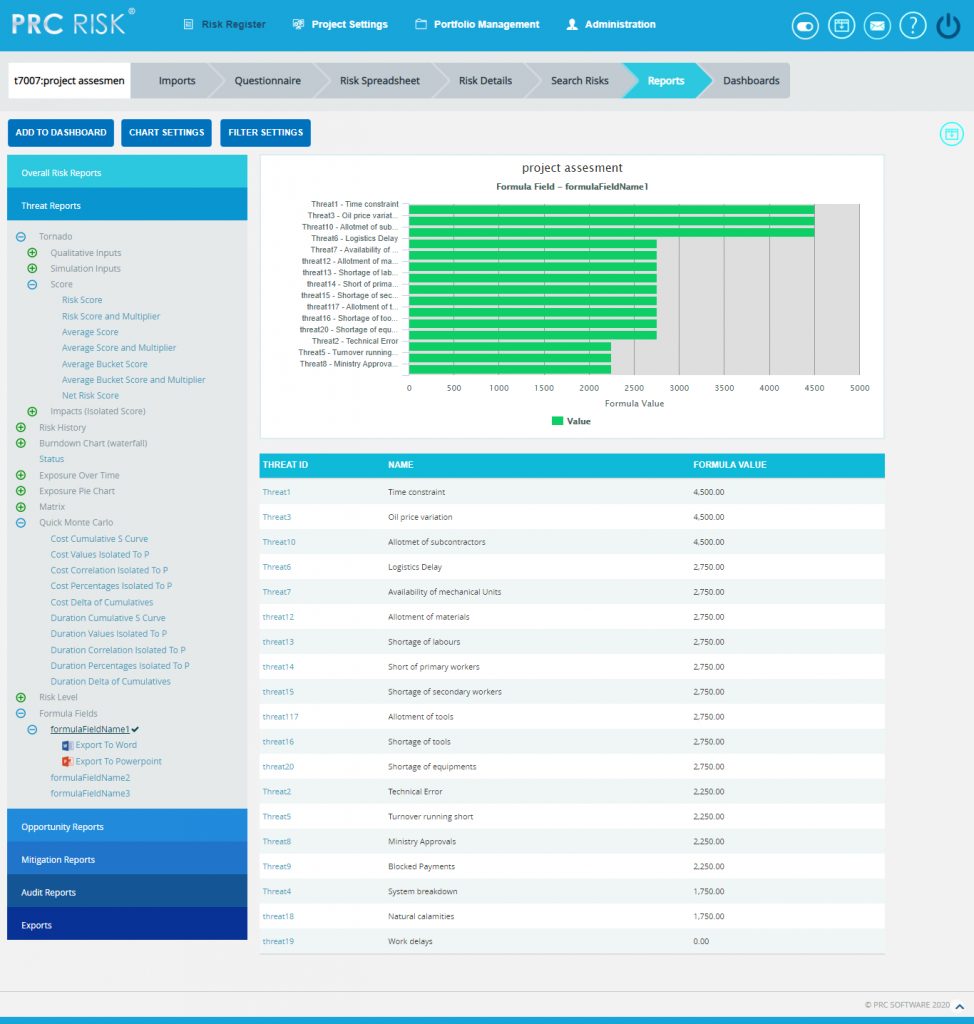
Figure 58
Risk count Pie Charts Reports:
The reports generated here show the count of each custom field and Risk Owner that is assigned to the threats/opportunities and the user can drill from these custom field and Risk Owner count which lands to spreadsheet page showing the threat/opportunity details. The custom fields are assigned to the threats/ opportunities through Risk Register ->Spreadsheet, Risk details and Import
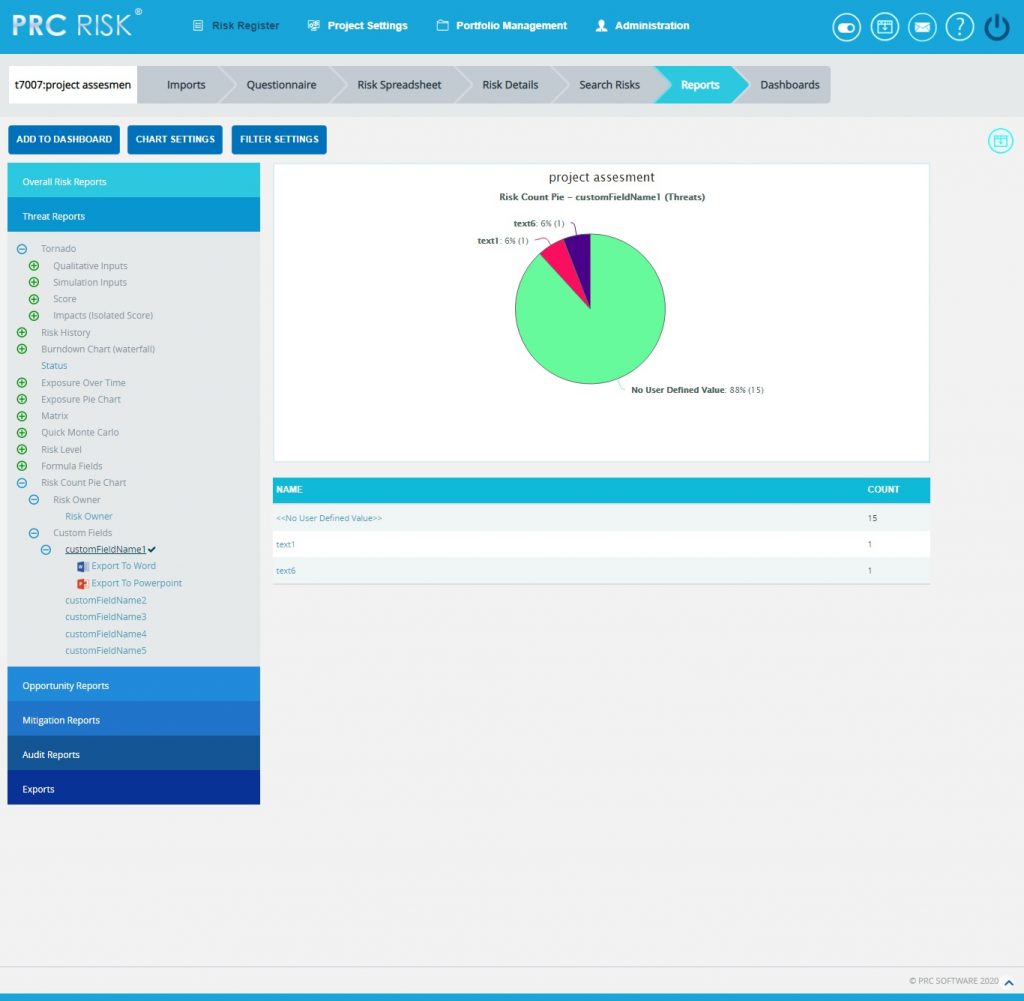
Figure 58.1
Email Settings:
This functionality is used to export the entire page to Word and send mail to the person selected. The functionality consists of two lists, Available Users and Selected Users. Available Users (Figure 59) contains all the portfolio level users. Selected Users (Figure 59) displays the users who have been selected. A user can be added to the Selected Users list using the Add button. All users under the Available Users list can be moved to Selected Users list using the Add All button. (Figure 59) A single user from the Selected Users list can be moved back to the Available Users list using the Remove button. The Remove All button moves all users from the Selected Users list to the Available Users list. The Subject by default has the value Chart Title, which can be changed if needed.
Steps:
- Risk Register –> Reports
- Generate the desired report by clicking on the type of reports provided to the left.
- Click the Email icon to send email.
- Select at least one user to whom mail should be sent.
- Enter the message on Message text area.
- Click the SEND MESSAGE button to finish. (Figure 59) To cancel, click the Cancel button. (Figure 59)
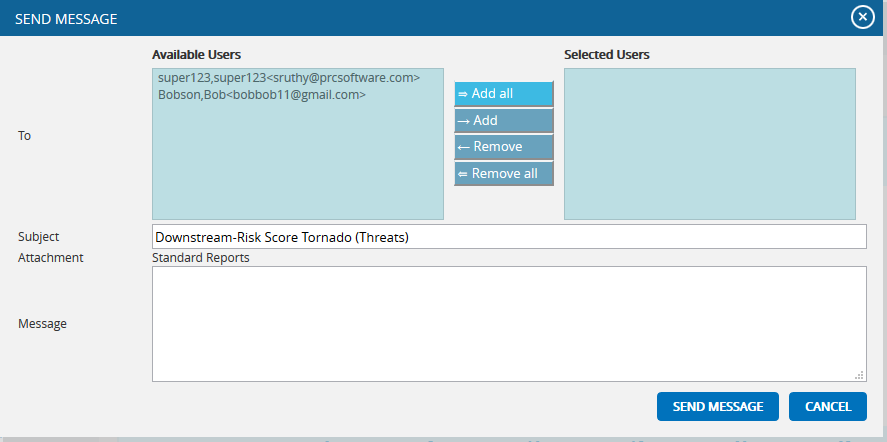
Figure 59
Chart Settings:
This functionality is used to modify the color of the charts generated, and also to create and save the editable chart settings and report script (Figure 60). The accessibility of these chart settings is different for different users.
- Users with global access Read/Write option – The editable drop-down has all the global shared chart settings as well as those saved at the personal level. Global access saved name cannot be edited at the global level.
- Users with global access Read only (view only) option – The editable drop-down has all the global shared chart settings as well as those saved at the personal level. The saved name stores only to the personal level, no other users can view that name.
- Users with global access No access option – The editable drop-down has only the chart settings saved at personal level. The saved name stores only to the personal level, no other users can view that name.
Each chart has its own chart setting.
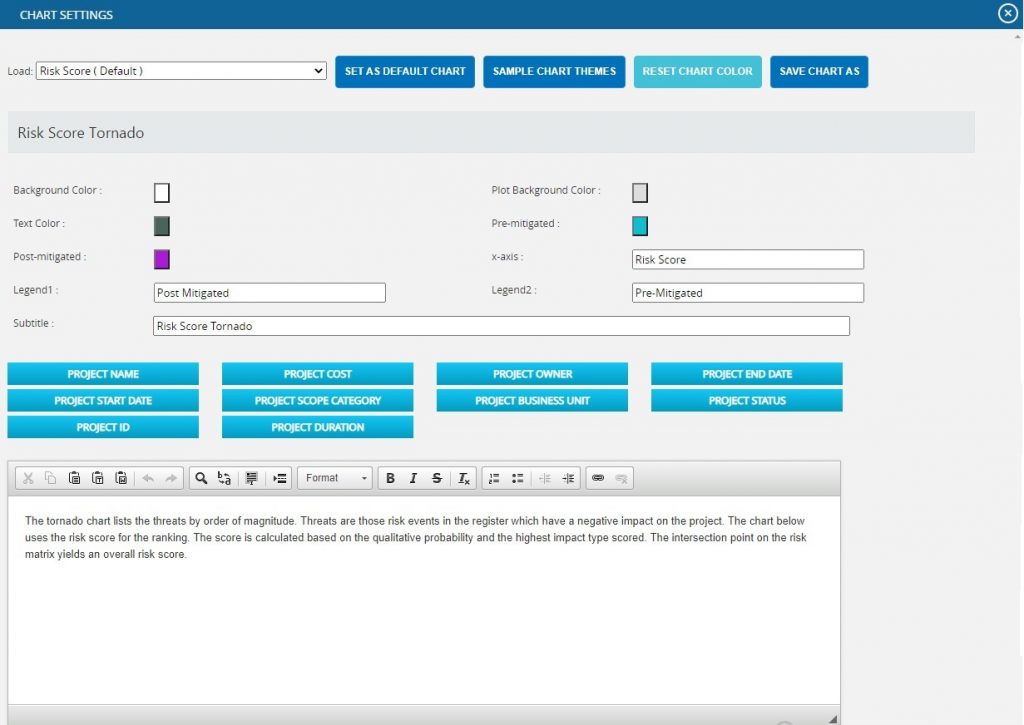
Figure 60
The color is set by clicking on the corresponding color shown beside each field. An example of the color picker for various fields is shown in Figure 61.

Figure 61
Edit Color:
Steps:
- Risk Register —> Reports
- Click the CHART SETTINGS (Figure 1) A Chart Settings pop up appears. (Figure 60)
- Modify the colors needed.
Insert Variables to Report Script:
This functionality is to insert the variables like Project Name, Project Cost, Project Owner etc., to the report script of each chart.
Steps:
- Risk Register —> Reports
- Click the CHART SETTINGS button. (Figure 1) A Chart Settings pop up appears. (Figure 60)
- To insert the variables, place the cursor anywhere in the report script and click the required variable buttons. (Figure 60)
Save As:
This functionality is used to save the user editable chart settings globally or locally with a name and description.
Steps:
- Risk Register –> Reports
- Click the CHART SETTINGS button. (Figure 1)
- Edit the report script and chart settings and click SAVE AS (Figure 60)
- Give the name and description to save and also give the global access option in the pop up appears. (Figure 62)
- Click the SAVE (Figure 62)
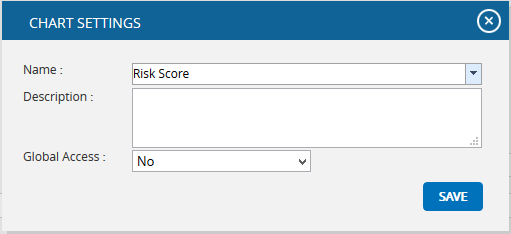
Figure 62
Set As Default Chart:
This functionality is to set the selected chat settings name, as the default chart.
Steps:
- Risk Register —> Reports
- Click the CHART SETTINGS button to go to the chart settings page. (Figure 1)
- Select a name from the Load (Figure 60)
- Click the SET AS DEFAULT CHART button to set the selected chart as default. (Figure 60)
Delete:
This functionality is to delete the selected chart settings name from the Load dropdown. This button appears only for the created users. The default chart settings name cannot be deleted by any user.
Steps:
- Risk Register —> Reports
- Click the CHART SETTINGS button to go to the chart settings page. (Figure 1)
- Select a name from the Load (Figure 60)
- Click the DELETE button to delete.
Reset:
This functionality is used to reset all the values and report script of the chart to predefined values and script.
Steps:
- Risk Register —> Reports
- Click the CHART SETTINGS button to go to the chart settings page. (Figure 1)
- Click the RESET CHART COLOR button to reset the values and report script. (Figure 60)
Sample Chart Themes:
This functionality is used to select a chart theme from the list of default samples.
Steps:
- Risk Register –> Reports
- Click the CHART SETTINGS button to go to the chart settings page. (Figure 1)
- Select a name from the Load (Figure 60)
- Click the SAMPLE CHART THEME (Figure 60)
- Select the required sample from the set of themes that appear in the CHART SAMPLE THEMES pop up. (Figure 63)
- Click the SELECT THEME button to proceed. (Figure 63)
- Click SAVE CHART AS (Figure 60)
- Give the name and description to save and also give the global access option in the pop up which appears. (Figure 62)
- Click the SAVE (Figure 62)
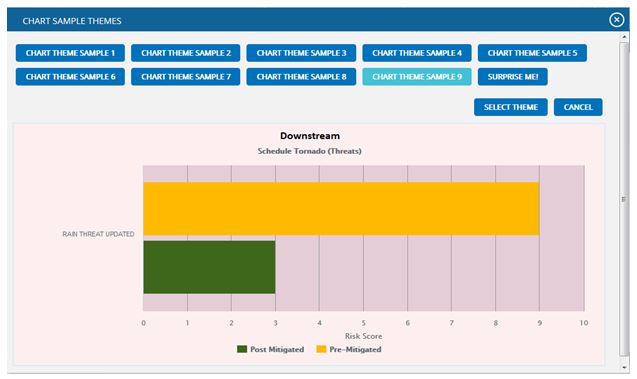
Figure 63
Add To Managers Dashboard:
This functionality is used to add the chart generated to the project´s Managers Dashboard. A user with View access cannot add a chart to Managers Dashboard.
Steps:
- Risk Register –> Reports
- Generate the desired report by clicking on the type of reports provided to the left.
- Click the ADD TO DASHBOARD button. (Figure 1) A pop up shown in Figure 64 appears.
- Enter or select the name. Enter description.
- Click the SAVE button to finish. (Figure 64)
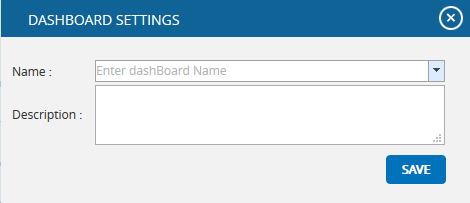
Figure 64
Export to Word:
This functionality is used to export the chart and data table generated to Word.
Steps:
- Risk Register —> Reports
- Generate the desired report by clicking on the type of reports provided to the left.
- Click the Export to Word link. (Figure 1)
Export to PowerPoint:
This functionality is used to export the chart generated to PowerPoint.
Steps:
- Risk Register —> Reports
- Generate the desired report by clicking on the type of reports provided to the left.
- Click the Export to PowerPoint link. (Figure 1)
Overall Risk Reports:
Overall Risk Tornado:
The Overall Risk Tornado shows all the threats and opportunities on a single tornado with the opportunities being to the left of the zero and the threats being to the right of the zero. The sort order should be based on a next value.
Steps:
- Risk Register –> Reports
- Click the Overall Risk Reports link to select Overall Risk Tornado Chart. (Figure 1)
- Select the Qualitative Inputs or Simulation Inputs or Score data options to view the charts based on qualitative or simulative inputs or score. (Figure 65)
- Select Pre-Mitigated to view Pre-Mitigated data only (sorted by Pre-Mitigated), Post-Mitigated to view Post-Mitigated data (sorted by Post-Mitigated) from the dropdown. (Figure 10)
- Click the Highest Cost Impact data option or any other data option to generate the report. (Figure 65) The chart generated and the data table is shown in Figure 66.
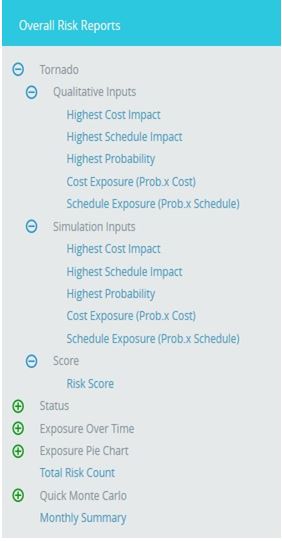
Figure 65
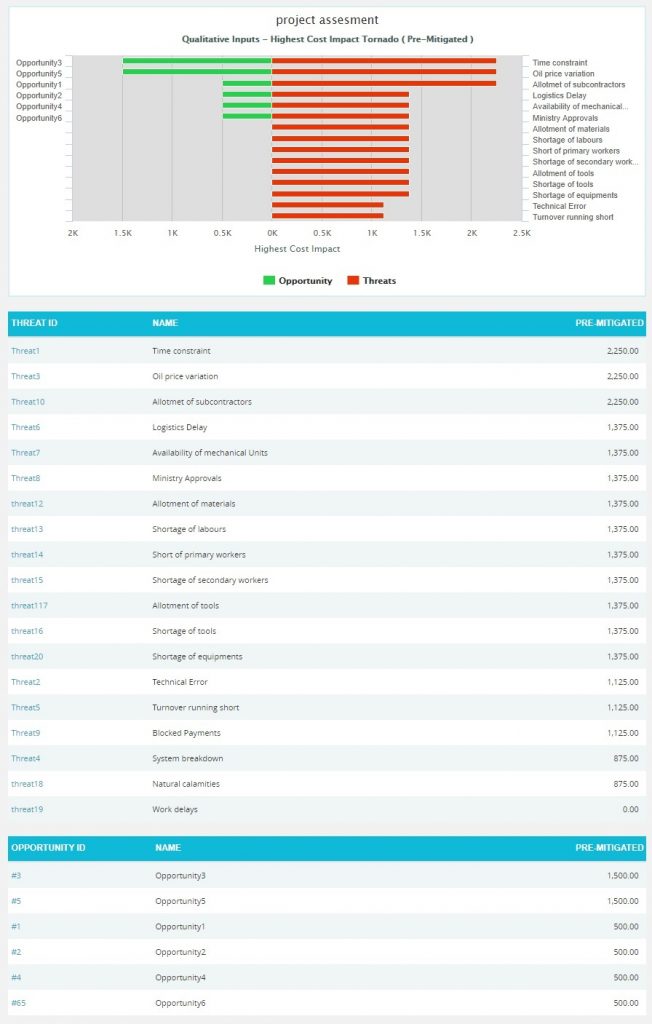
Figure 66
Overall Risk Status:
The Overall Risk status has two statuses, Threat and Opportunity Status which is represented by a bar diagram that shows total number of threats and opportunities in all statuses and Total Threats and Opportunities which is represented by a pie chart that shows total number of threats and opportunities in open status.
- Risk Register —> Reports
- Click the Status from the Overall Risk Reports (Figure 67).
- Click Threat and Opportunity Status to view the chart showing the total number of threats and opportunities in all statuses. The chart generated and the data table is shown in Figure 67.
- Click Total Threats and Opportunities to view the chart showing the total number of threats and opportunities in open status. The chart generated and the data table is shown in Figure 68.
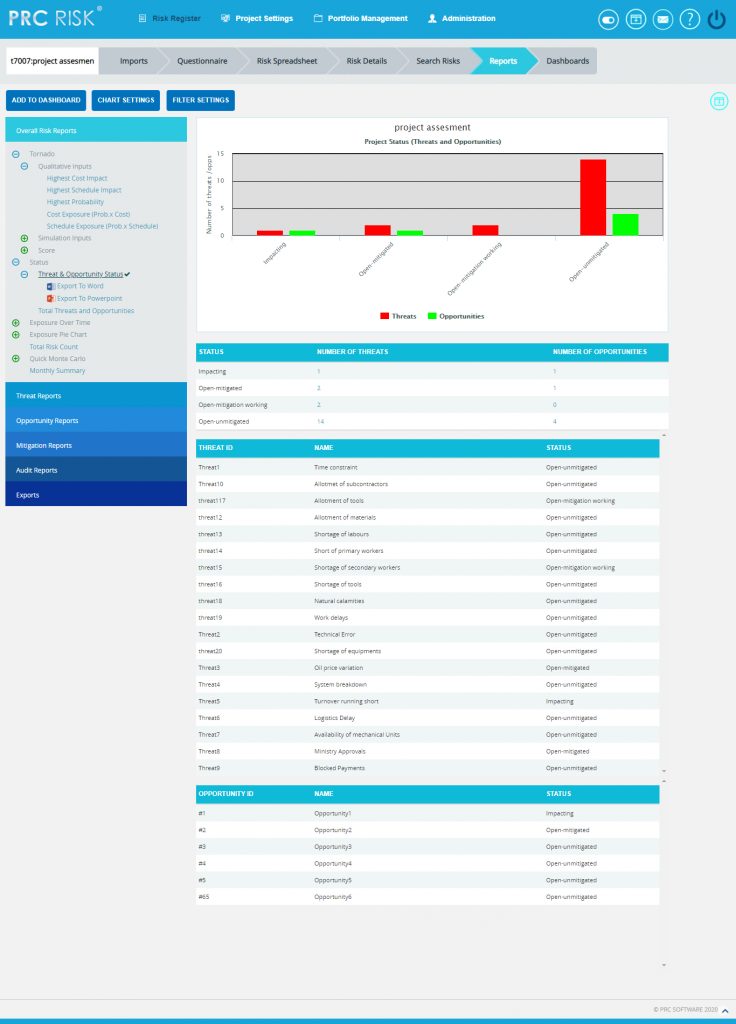
Figure 67
![]()
Figure 68
Overall Risk Exposure Over Time:
The Overall Risk Exposure over Time chart is generated based on the Qualitative Cost Exposure, Simulation Cost Exposure, Qualitative Schedule Exposure and Simulation Schedule Exposure for all the threats and opportunities in the selected project. The values on the chart would be a combination of threats and opportunities. Threats would be a positive value and Opportunities would count as a negative value in the net value on the chart.
Steps:
- Risk Register –> Reports
- Click the Exposure over Time link under Overall Risk Reports. (Figure 1)
- Select Pre-Mitigated to view Pre-Mitigated data only (sorted by Pre-Mitigated), Post-Mitigated to view Post-Mitigated data (sorted by Post-Mitigated) from the dropdown. (Figure 10)
- Click the Cost under Simulation/Qualitative link or any other data option to generate the report. (Figure 69) The chart generated and the data table is shown in Figure 70.
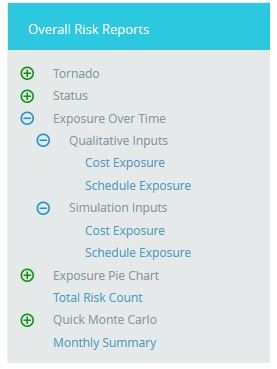
Figure 69
![]()
Figure 70
The Column Date of the data table (Figure 70) contains a link that navigates the user to the following charts:
- Simulation Cost Exposure Tornado (Threat), if the option Cost Under Simulation For Threat Reports is selected.
- Qualitative Cost Exposure Tornado (Threat), if the option Cost Under Qualitative For Threat Reports is selected.
- Simulation Schedule Exposure Tornado (Threat), if the option Schedule Under Simulation For Threat Reports is selected.
- Qualitative Schedule Exposure Tornado (Threat), if the option Schedule Under Qualitative For Threat Reports is selected
- Simulation Cost Exposure Tornado (Opportunities), if the option Cost Under Simulation For Opportunity Reports is selected.
- Qualitative Cost Exposure Tornado (Opportunities), if the option Cost Under Qualitative For Opportunity Reports is selected.
- Simulation Schedule Exposure Tornado (Opportunities), if the option Schedule Under Simulation For Opportunity Reports is selected.
- Qualitative Schedule Exposure Tornado (Opportunities), if the option Schedule Under Qualitative For Opportunity Reports is selected.
Overall Risk Simulation Exposure Pie Chart:
The Overall Risk Simulation Exposure Pie Chart depends on the simulation cost exposure of the threats and opportunities mapped to the break down structure in the selected project.
Steps:
- Risk Register —> Reports
- Click the Exposure Pie Chart link under Overall Risk Reports. (Figure 1)
- Select Pre-Mitigated to view Pre-Mitigated data only (sorted by Pre-Mitigated), Post-Mitigated to view Post-Mitigated data (sorted by Post-Mitigated) from the dropdown. (Figure 10)
- Click the Project-WBS link or any other data option to generate the report. (Figure 71) The chart generated and the data table is shown in Figure 72.
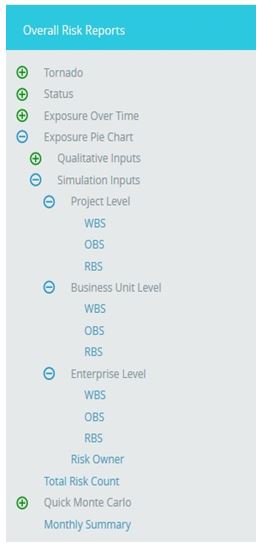
Figure 71
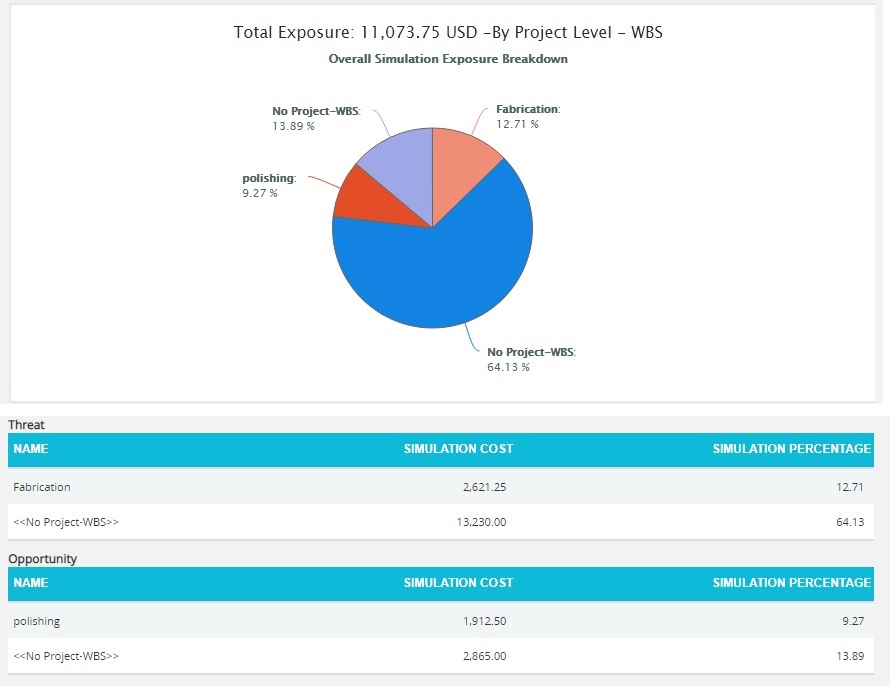
Figure 72
Overall Risk Qualitative Exposure Pie Chart:
The Overall Risk Qualitative Exposure Pie Chart depends on the qualitative cost exposure of the threats and opportunities mapped to the break down structure in the selected project.
Steps:
- Risk Register —> Reports
- Click the Exposure Pie Chart link under Overall Risk Reports. (Figure 1)
- Select Pre-Mitigated to view Pre-Mitigated data only (sorted by Pre-Mitigated), Post-Mitigated to view Post-Mitigated data (sorted by Post-Mitigated) from the dropdown. (Figure 10)
- Click the Project-WBS link or any other data option to generate the report. (Figure 73) The chart generated and the data table is shown in Figure 74.
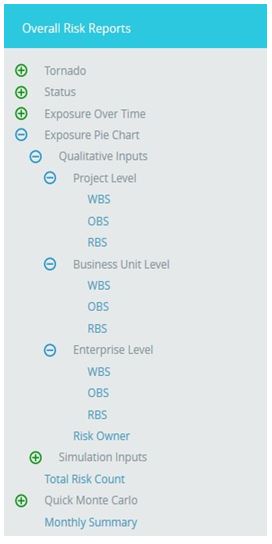
Figure 73
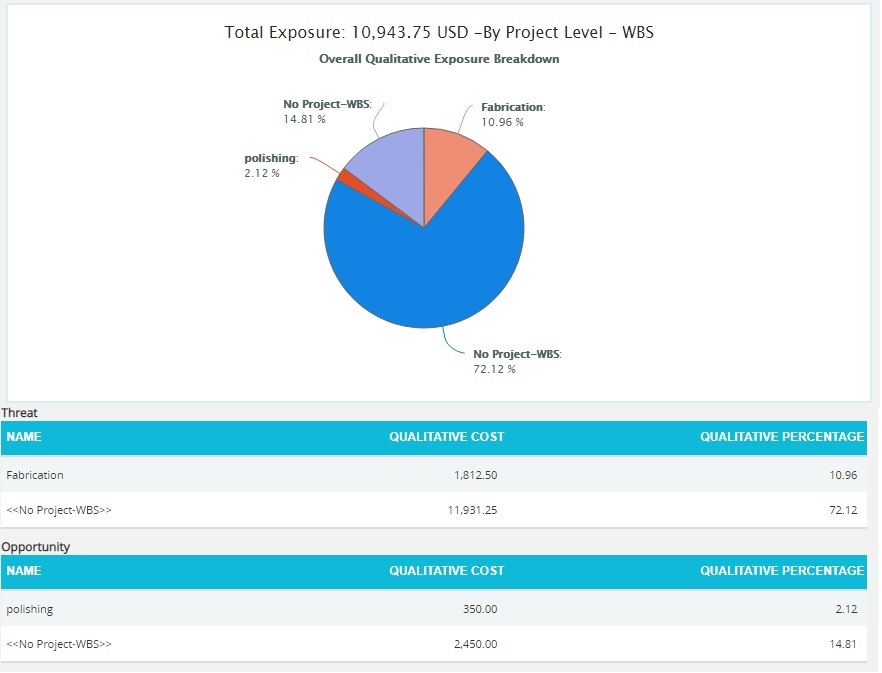
Figure 74
Total Risk Count:
The Total Risk Count chart shows the total count of risks in the selected project, while counting the total number of Threats and Opportunities separately. The Threats and Opportunities count is shown both in percentage and number.
Steps:
- Risk Register —> Reports
- Click the Total Risk Count link under Overall Risk Reports. (Figure 75)
- The chart generated and the data table is shown in Figure 75.
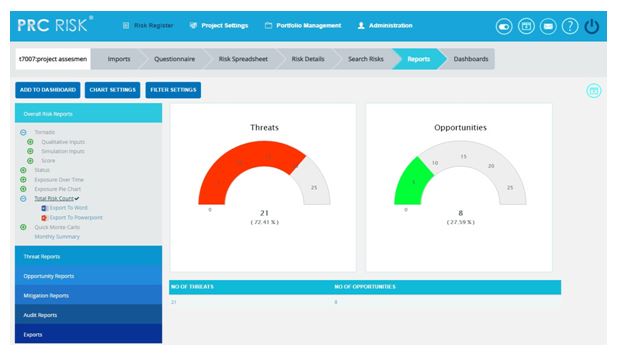
Figure 75
Overall Quick Monte Carlo:
Cost Cumulative S Curve:
The Cost Cumulative S Curve report shows the distribution of Cost Exposure of the threats and opportunities of a selected project. It simulates threats and opportunities cost values using Triangular Distribution. The columns show the hits for each of the total amount of risk cost exposure. The S curve shows the cumulative frequency of the hits in percentage.
Steps:
- Risk Register —> Reports
- Click the Quick Monte Carlo link under Overall Reports. (Figure 1)
- Click the Cost Cumulative S Curve (Figure 76) The chart generated and the data table is shown in Figure 76.
- Click the FILTER SETTINGS. Cost Analysis Inputs pop up appears where the Iteration number and the Highlights are given based on which the Cumulative Frequency iterations and the Cumulative percentage values to be highlighted are shown in the chart and table for pre-mitigated and post mitigated options. (Figure 77.1 and Figure 77.2)
- Click the RUN ANALYSIS AND SHOW REPORT button to view the filtered report for pre-mitigated and post mitigated options. (Figure 77.1 and Figure 77.2)
- Click REFRESH button to refresh the chart. (Figure 76)
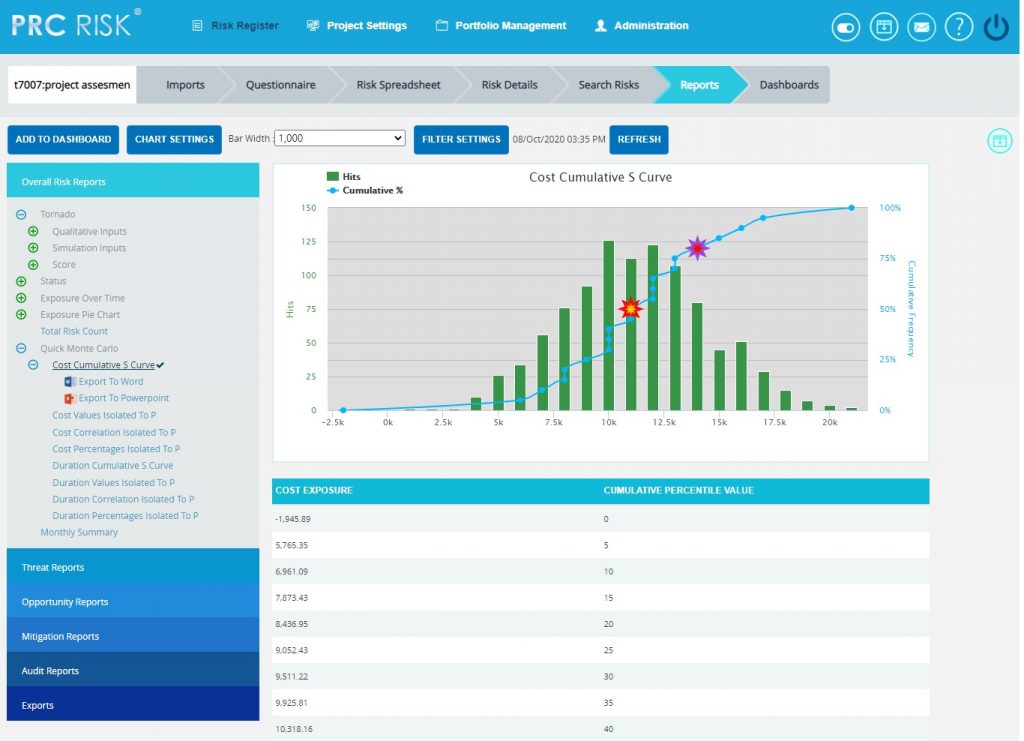
Figure 76
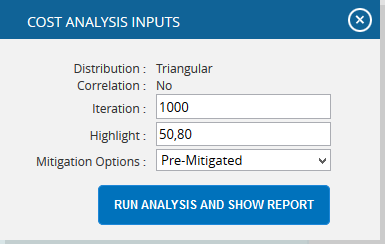
Figure 77.1

Figure 77.2
Top Risk Reports:
The Top Risk reports are Tornado Charts that shows the top ten threats and opportunities on a single tornado with the opportunities being to the left of the zero and the threats being to the right of the zero. It depends on the simulated cost exposure values of each top Threat and Opportunity up to the Pn iteration value, where `n´ is the percentile value of total number of iterations given. Cost Exposure is the qualitative cost multiplied by probability percentage. The Top Risk reports include Cost Values Isolated to P and Cost Percentages Isolated to P reports.
Steps:
- Risk Register —> Reports
- Click the Quick Monte Carlo link under Overall Reports. (Figure 1)
- Click the Cost Values Isolated to P / Cost Percentages Isolated to P link. (Figure 78) The chart generated and the data table is shown in Figure 78.
- Click the FILTER SETTINGS. Cost Analysis Inputs pop up appears where the Cumulative Frequency iteration number is given based on which the iterations are shown in the chart and in the table for pre-mitigated and post mitigated options. (Figure 77.1 and Figure 77.2)
- Click the RUN ANALYSIS AND SHOW REPORT button to view the filtered report for pre-mitigated and post mitigated options. (Figure 77.1 and Figure 77.2)
- Click REFRESH button to refresh the chart. (Figure 78)
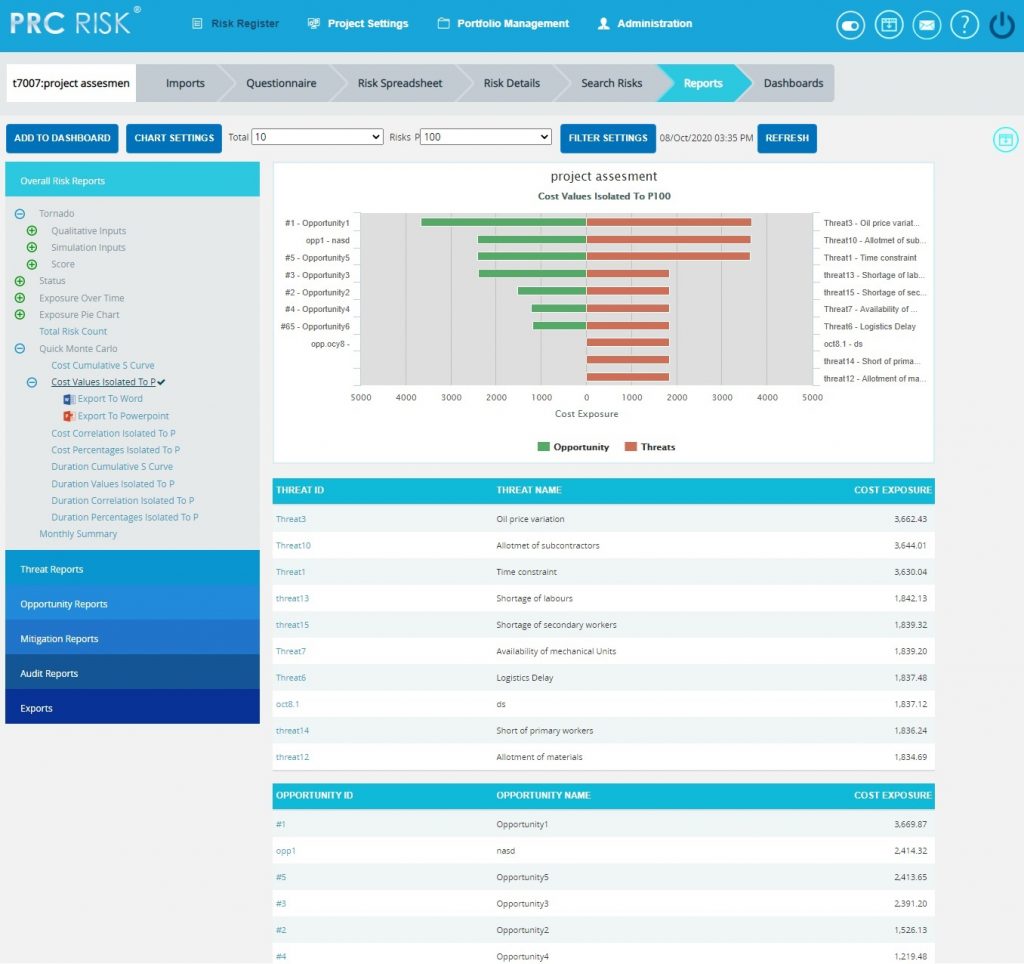
Figure 78
Duration Cumulative S Curve:
The Duration Cumulative S Curve report shows the distribution of Duration Exposure of the threats and opportunities of a selected project. It simulates threats and opportunities duration values using Triangular Distribution. The columns show the hits for each of the total amount of risk duration exposure. The S curve shows the cumulative frequency of the hits in percentage.
Steps:
- Risk Register —> Reports
- Click the Quick Monte Carlo link under Overall Reports. (Figure 1)
- Click the Duration Cumulative S Curve (Figure 79) The chart generated and the data table is shown in Figure 79.
- Click the FILTER SETTINGS. Duration Analysis Inputs pop up appears where the Iteration number and the Highlights are given based on which the Cumulative Frequency iterations and the Cumulative percentage values to be highlighted are shown in the chart and table for pre-mitigated and post mitigated options. (Figure 80.1 and Figure 80.2)
- Click the RUN ANALYSIS AND SHOW REPORT button to view the filtered report for pre-mitigated and post mitigated options. (Figure 80.1 and Figure 80.2)
- Click REFRESH button to refresh the chart. (Figure 79)
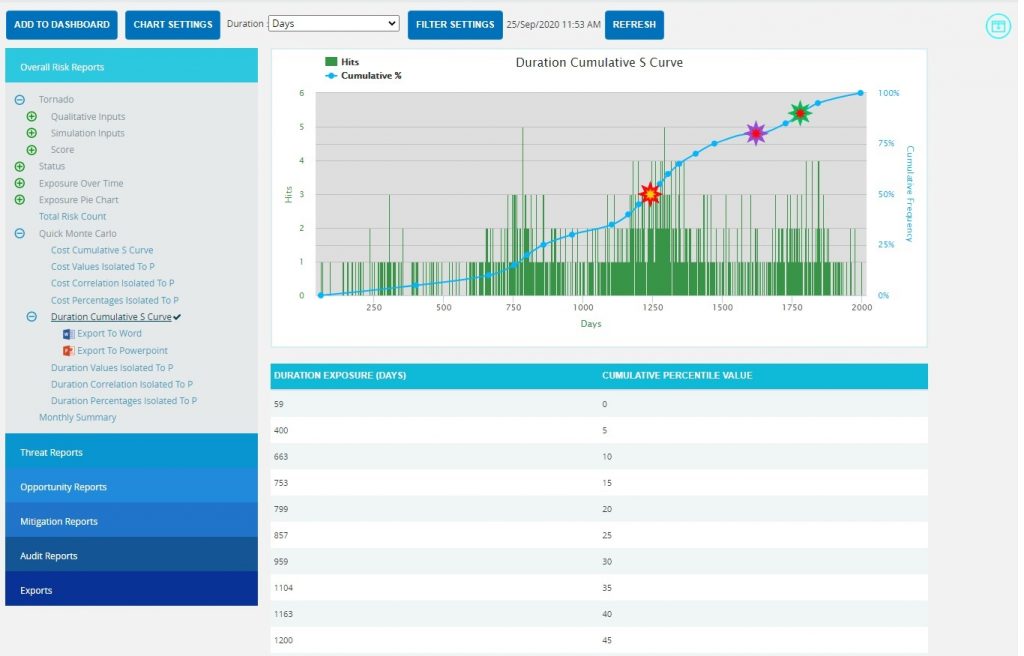
Figure 79

Figure 80.1

Figure 80.2
Top Risk Reports:
The Top Risk reports are Tornado Charts that shows the top ten threats and opportunities on a single tornado with the opportunities being to the left of the zero and the threats being to the right of the zero. It depends on the simulated duration exposure values of each top Threat and Opportunity up to the Pn iteration value, where `n´ is the percentile value of total number of iterations given. Duration Exposure is the qualitative duration multiplied by probability percentage. The Top Risk reports include Duration Values Isolated to P and Duration Percentages Isolated to P reports.
Steps:
- Risk Register —> Reports
- Click the Quick Monte Carlo link under Overall Reports. (Figure 1)
- Click the Duration Values Isolated to P / Duration Correlation Isolated to P / Duration Percentages Isolated to P link. (Figure 81) The chart generated and the data table is shown in Figure 81.
- Click the FILTER SETTINGS. Duration Analysis Inputs pop up appears where the Cumulative Frequency iteration number is given based on which the iterations are shown in the chart and in the table for Pre-Mitigated and Post-mitigated options. (Figure 80.1 and Figure 80.2)
- Click the RUN ANALYSIS AND SHOW REPORT button to view the filtered report for Pre-Mitigated and Post-mitigated options. (Figure 80.1 and Figure 80.2)
- Click REFRESH button to refresh the chart. (Figure 81)
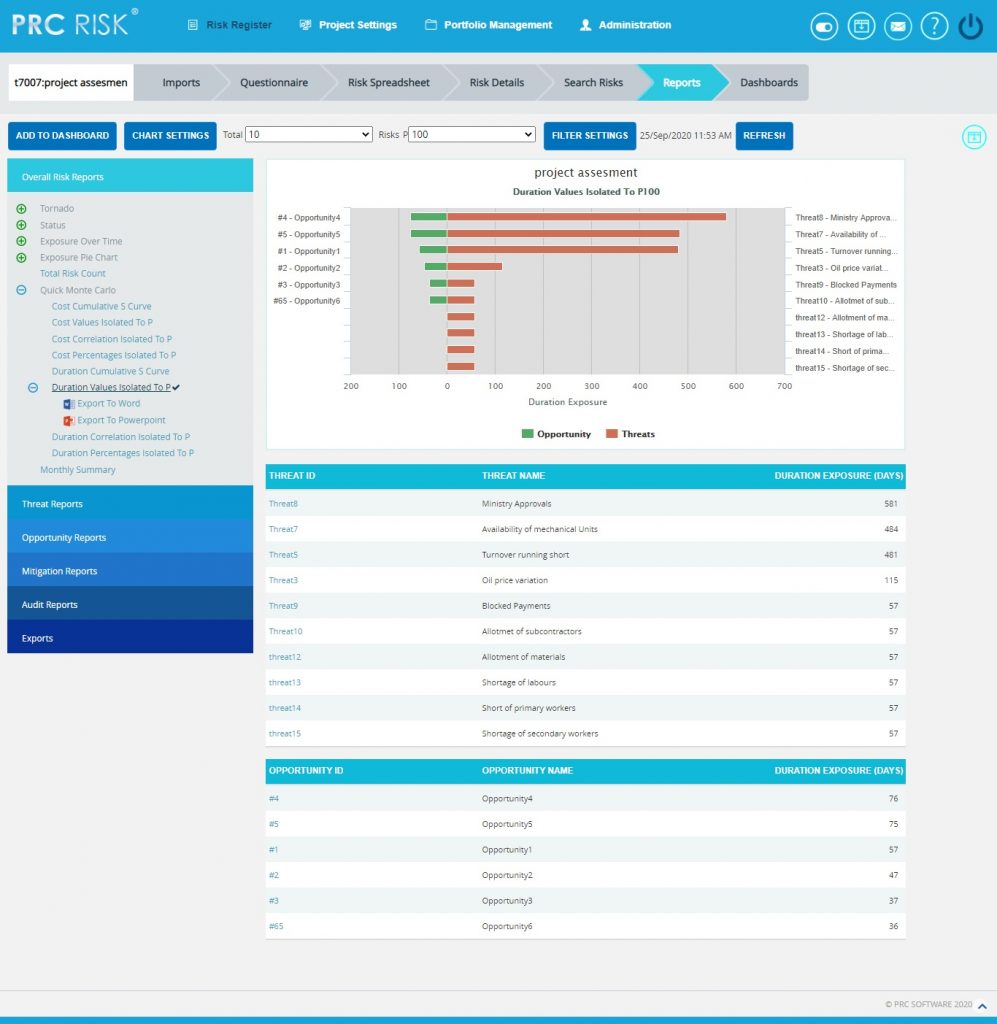
Figure 81
Overall Risk Monthly Summary:
The Monthly Summary report shows summary of the raised threats/opportunities/mitigations of the particular project in that month and also shows the details of threat/opportunities/mitigations which are not scored. The summary generated with Id and Name. (Figure 82)
Steps:
- Risk Register —> Reports
- Click the Monthly Summary link under Overall Reports. (Figure 1)
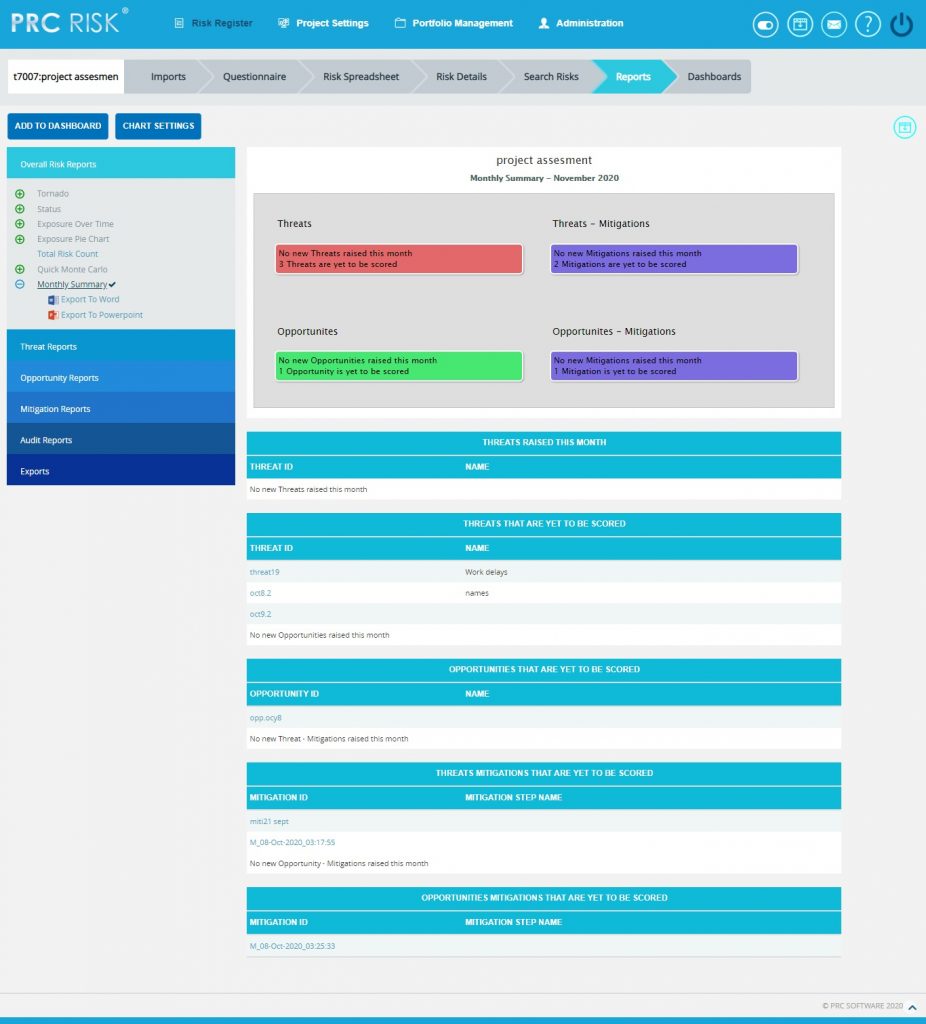
Figure 82
Mitigation Reports:
Mitigation Status:
This functionality is to display the risks and its mitigation details based on the mitigation status in the selected project whose value is open, closed, proposed, in progress, rejected, complete, risk closed or approved. The Status chart is represented by a pie chart and corresponds to the status assigned to the risk.
Steps:
- Risk Register —> Reports
- Click the Mitigation Reports link to select the Status (Figure 83)
- Click the Mitigation Status to generate the chart and data tables Figure 84. The mitigation status can be drilled down to the Spreadsheet View Page and can be further drilled down to view the advanced view page.
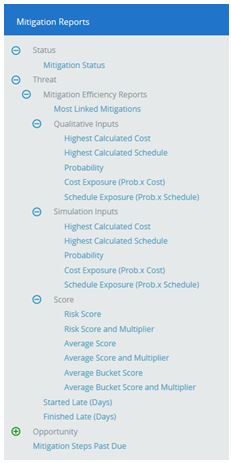
Figure 83
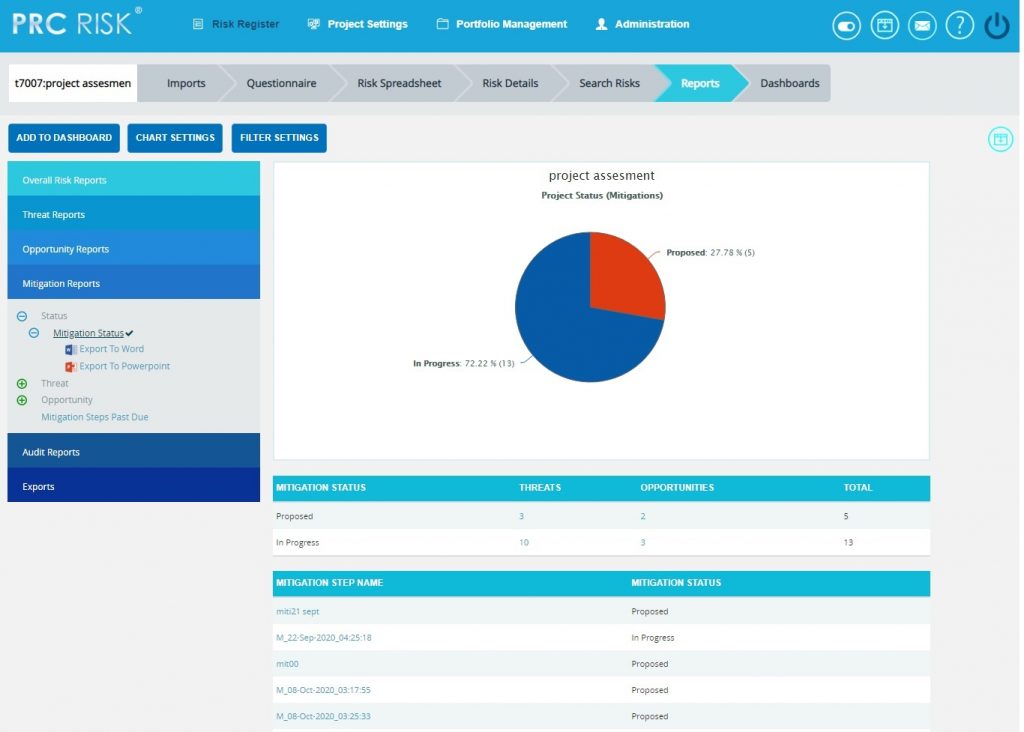
Figure 84
Mitigation Efficiency Reports:
The Mitigation Efficiency reports are Tornado charts that list the top efficient mitigations linked to threats or opportunities by order of magnitude. These reports consider the mitigations that reduce the overall impacts of the mapped threats or opportunities. The Most Linked Mitigations reports show the top efficient mitigations linked to the most number of threats or opportunities. The other reports under the mitigation efficiency show the sum of the differences of corresponding values of each risks mapped to the mitigation.
Steps:
- Risk Register —> Reports
- Click the Mitigation Reports link to select Threat / Opportunity Mitigation Efficiency Reports. (Figure 83)
- Click the Most Linked Mitigations data option (Figure 85.1) or any other data option (Figure 85.2) to generate the report and the data.
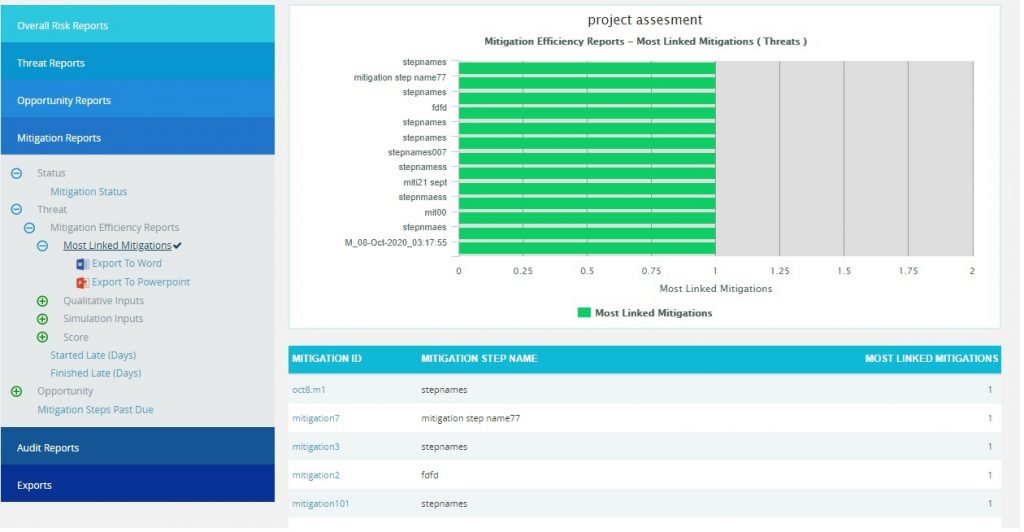
Figure 85.1
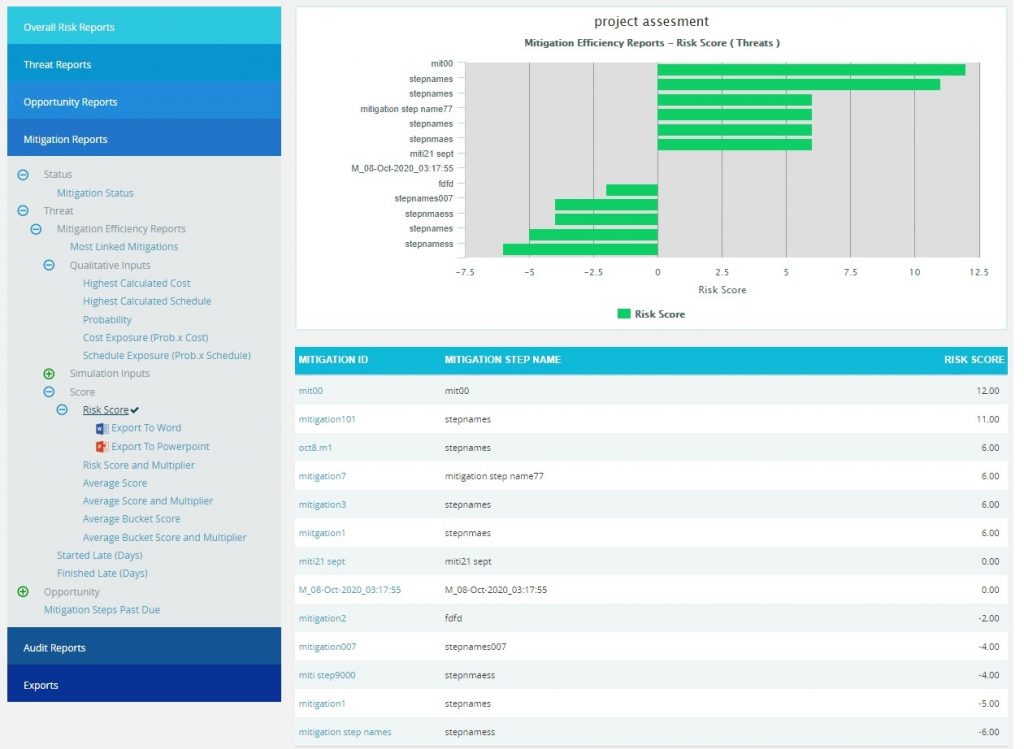
Figure 85.2
Mitigation Steps Past Due:
The Mitigation Steps Past Due shows all mitigation steps that are past due in the selected project. This is calculated on the basis of the number of days that a mitigating action has started or finished late. In this chart the needle is pointed to the total number of overdue mitigations.
Steps:
- Risk Register —> Reports
- Click the Mitigation Steps Past Due link under Mitigation Reports. (Figure 86)
- The chart generated and the data table is shown in Figure 86.
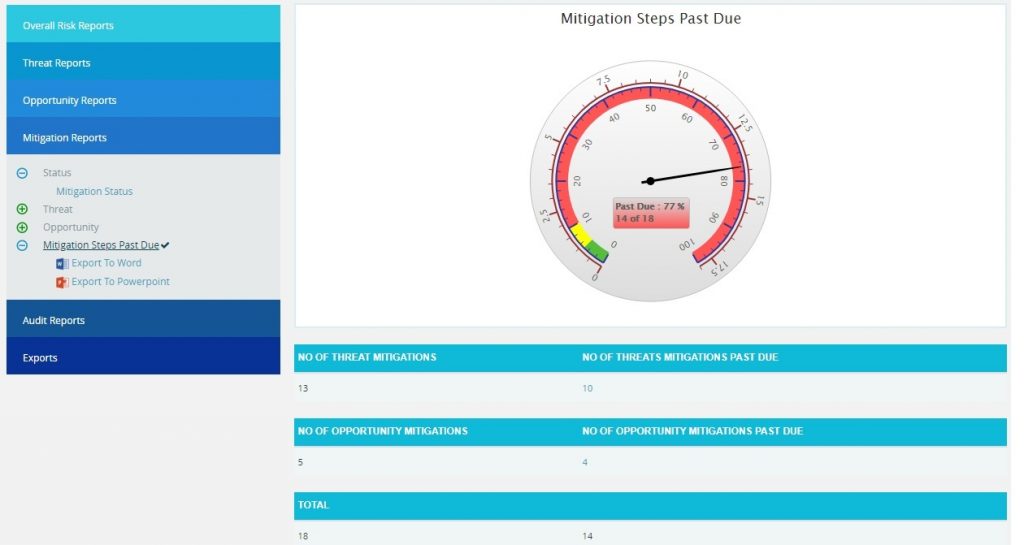
Figure 86
Exports:
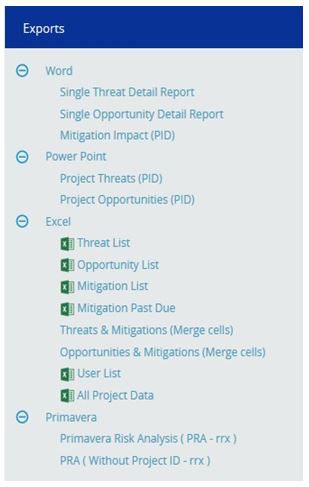
Figure 87
Single Threat Detail Report:
The Single Threat Detail Report shows the details of the threat summary of the selected threat (Figure 88). Select Threat Id from the Select Risk drop-down to view the summary report of the threat. To export the threat summary report to Word, click the Export to Word link.
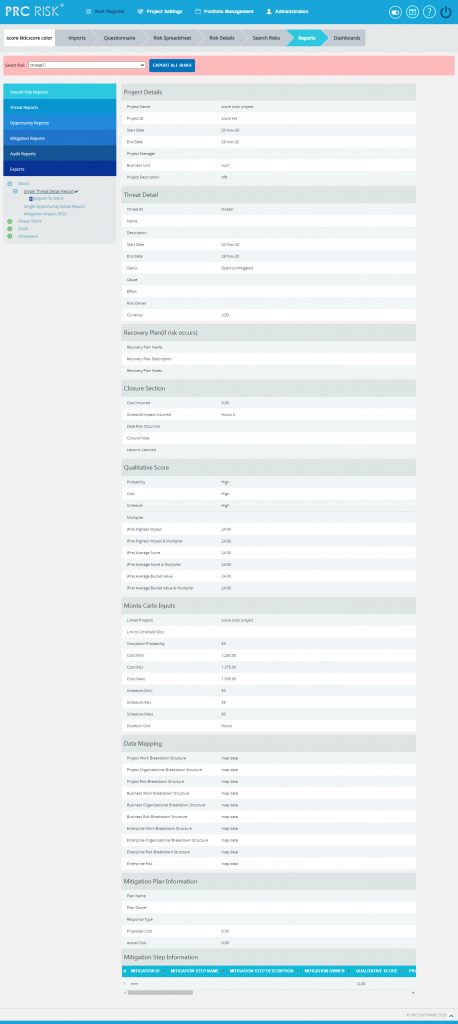
Figure 88
Single Opportunity Detail Report:
The Single Opportunity Detail report shows the details of the selected opportunity (Figure 89). Select Opportunity Id from the Select Risk drop-down to view the summary report of the opportunity.

Figure 89
Mitigation Impact (PID) Report:
The Mitigation Impact (PID) report shows the details of the mitigations for the selected threat/ opportunity (Figure 90).
Steps:
- Select Threat/Opportunity from the Select Threat/Opportunity drop-down.
- Select Threat Id or Opportunity Id from the Select Risk drop-down to view the mitigation summary of the Threat/Opportunity.
- To export mitigation summary report to Word, click the Export to Word link.
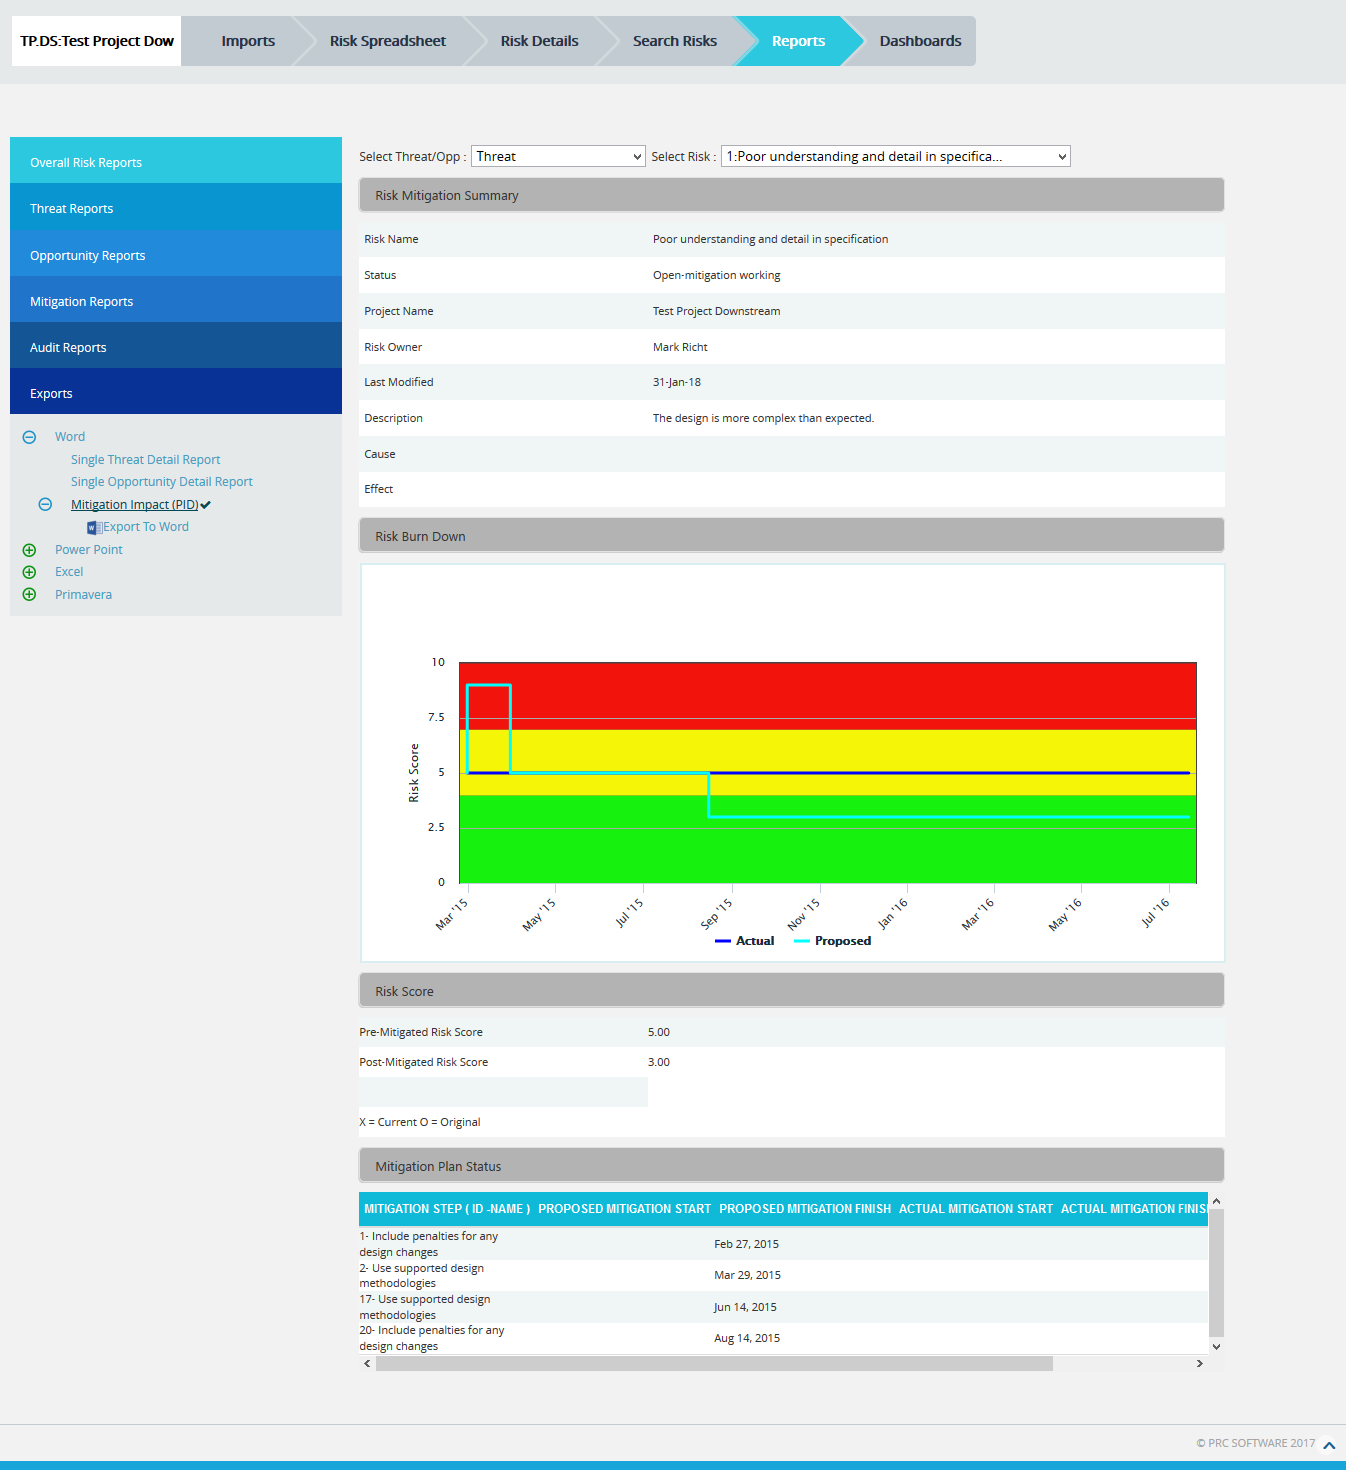
Figure 90
Project Threats (PID):
The Project Threats (PID) page provides a summary of all the risks (both open and closed) in the project. (Figure 91) The details of those risks whose Risk Score is 0.000 will not be displayed in this page. The Risk Overview page also provides a mitigation summary report of each risk. While it is exported to Power point, the highest 10 numbers of burn down chart will be created.
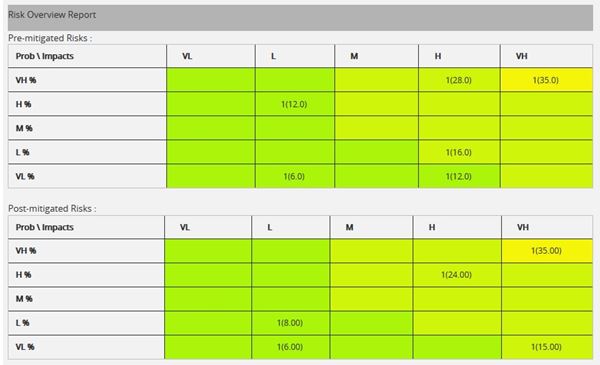
Figure 91
Pre-Mitigated Risks:
The Pre-Mitigated Risks section shows the Pre-mitigated risk score of all the risks in the project. 1(24.00) indicates that only one threat has a pre-mitigated score of 24.00.
Post-Mitigated Risks:
The Post-Mitigated Risks section shows the Post-mitigated risk score of all the risks in the project.
1(24.000) indicates that only one threat has a post-mitigated score of 24.00.
Project Opportunities (PID):
The Project Opportunities (PID) page provides the overall information of all the risks (both open and closed) in the project. (Figure 92) The details of those risks whose Risk Score is 0.000 will not be displayed in this page. The Opportunity Overview page also provides a mitigation summary report of each risk. While it is exported to Power point, the highest 10 numbers of burn down chart will be created.
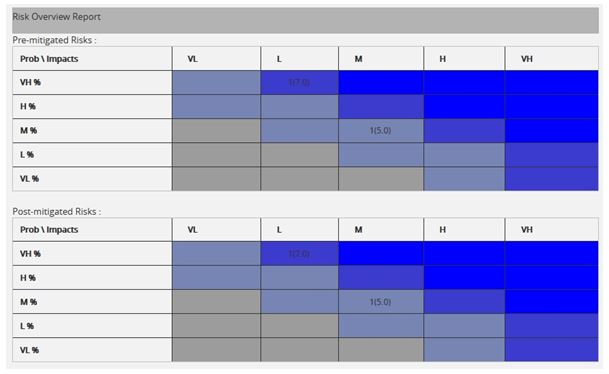
Figure 92
Pre-Mitigated Risks:
The Pre-Mitigated Risks section shows the Pre-mitigated risk score of all the risks in the project. 1(10.00) indicates that only one threat has a pre-mitigated score of 10.00.
Post-Mitigated Risks:
The Post-Mitigated Risks section shows the Post-mitigated risk score of all the risks in the project.
1(10.00) indicates that only one threat has a post-mitigated score of 10.00.
Export threat details:
This functionality is used to export the threat list of the selected project to MS Excel. A sample Excel sheet after export (only few fields are shown) is illustrated in Figure 93.
Steps:
- Risk Register —> Reports —> Exports
- Click the Threat List link to export. (Figure 87)

Figure 93
Export Opportunity details:
This functionality is used to export the opportunity list of the selected project to MS Excel. A sample Excel spreadsheet after export (only few fields are shown) is illustrated in Figure 94.
Steps:
- Risk Register —> Reports —> Exports
- Click the Opportunity list link to export. (Figure 87)
![]()
Figure 94
Export Mitigation details:
This functionality is used to export the mitigation list of the selected project to MS Excel. A sample Excel spreadsheet after export (only few fields are shown) including the mitigation details for both Threat and Opportunity is illustrated in Figure 95.
Steps:
- Risk Register —> Reports —> Exports
- Click the Mitigation List link to export. (Figure 87)
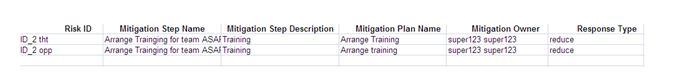
Figure 95
Export Mitigation Past Due details:
This functionality is used to export the mitigation past due list of the selected project to MS Excel. A sample sheet is shown (only few fields are displayed) in Figure 96. The Number of Days column in the mitigation past due list is calculated as follows:
Number of Days = Current Date –Proposed Mitigation Finish
For example, consider the first row in Figure 96. The Proposed Mitigation Finish is 03/23/2012 and if the current date is 04/12/2012, the Number of days = 20.
Steps:
- Risk Register —> Reports —> Exports
- Click the Mitigation Past Due link to export. (Figure 87)

Figure 96
Threats and Mitigations (Merge Cells):
The Threat and Mitigation (Merge Cells) report allows grouping of Threat Identification and Threat Analysis with its corresponding Mitigation Steps. The user has the option to set the fields, colors and titles for the three sections. To export this report to Excel, click Export to Excel link.
Steps:
- Risk Register —> Reports
- Click the Threats and Mitigations (Merge Cells) link under Exports. (Figure 97)
- Select the fields to be exported from the Available Fields column.
- Click the Copy button to copy the selected field to the Selected Fields column or click the Copy all button to copy all the fields to the Selected Fields.
- Similarly select the fields to be removed from the Selected Fields column and click the Remove button or click the Remove All button to remove all the fields from the Selected Fields column.
- Click RESET button to reset all the selected fields. (Figure 97)
- Click the Export to Excel link to export the selected fields. (Figure 97)

Figure 97
Opportunities and Mitigations (Merge Cells):
The Opportunities and Mitigations (Merge Cells) report allows grouping of Opportunity Identification and Opportunity Analysis with its corresponding Mitigation Steps. The user has the option to set the fields, colors and titles for the three sections. To export this report to Excel, click Export to Excel link.
Steps:
- Risk Register —> Reports
- Click the Opportunity and Mitigation (Merge Cells) link under Exports. (Figure 98)
- Select the fields to be exported from the Available Fields.
- Click the Copy button to copy the selected field to the Selected Fields column or click the Copy all button to copy all the fields to the Selected Fields.
- Similarly select the fields to be removed from the Selected Fields column and click the Remove button or click the Remove All button to remove all the fields from the Selected Fields column.
- Click RESET button to reset all the selected fields. (Figure 98)
- Click the Export to Excel link to export the selected fields. (Figure 98)
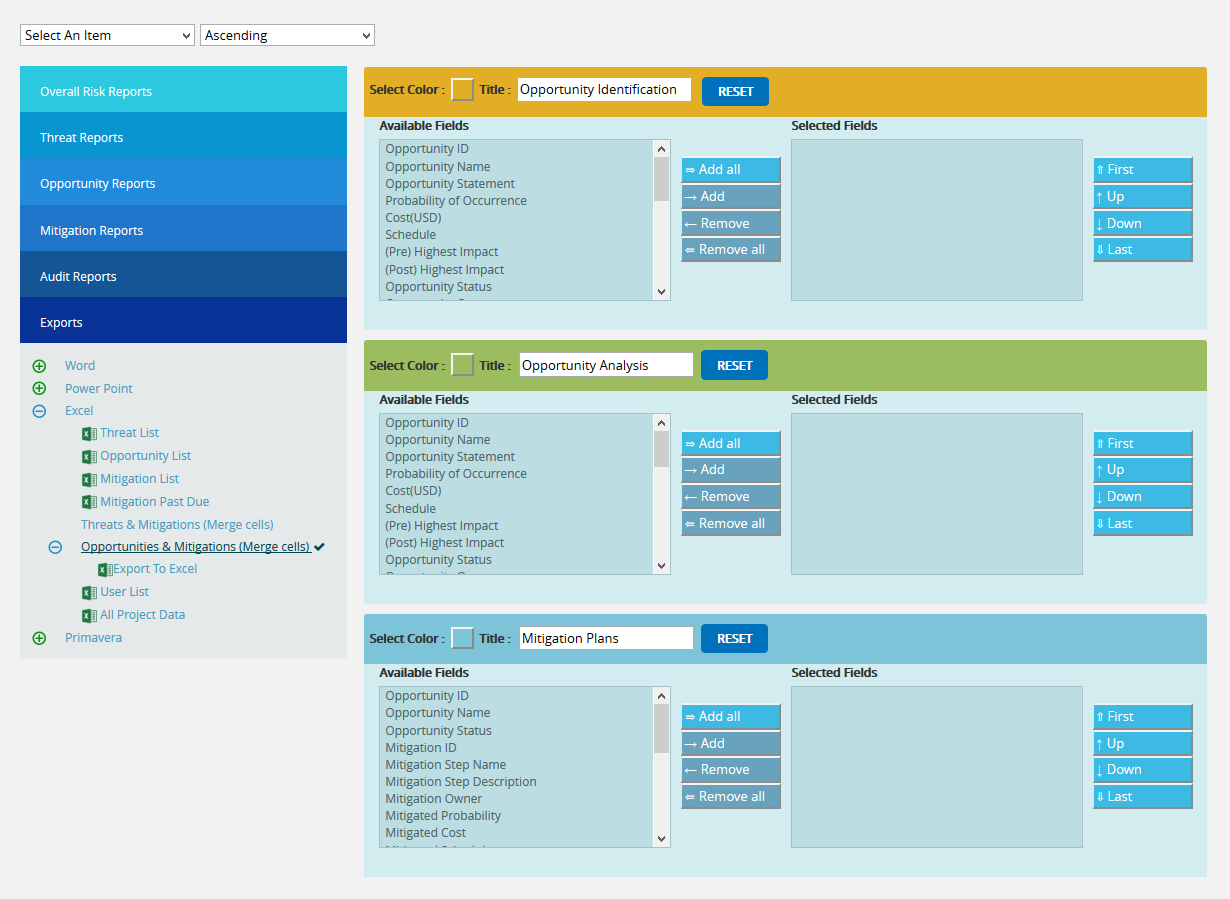
Figure 98
Export User Details:
This functionality is used to export the entire list of users assigned to the project to MS Excel. The sample spreadsheet shown in Figure 99 has all the user details in it.
Steps:
- Risk Register —> Reports —> Exports
- Click the User List link to export. (Figure 87)
The sample XML sheet generated is shown in Figure 99
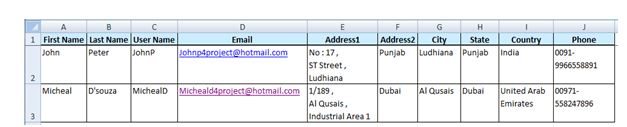
Figure 99
Export Risk Register to Primavera Risk:
This functionality is used to export the Threats, Opportunities and their Mitigation details of the selected Project along with the linked Project Ids and its corresponding Task Ids that can be viewed / imported using the Primavera Risk (Pert master) tool. The PRA (Without Project ID-rrx) exports all the details without the Project Ids.
Steps:
- Risk Register —> Reports —> Standard Reports
- Click the Export to Pert master links to export. (Figure 87)
The sample XML sheet generated is shown in Figure 100.
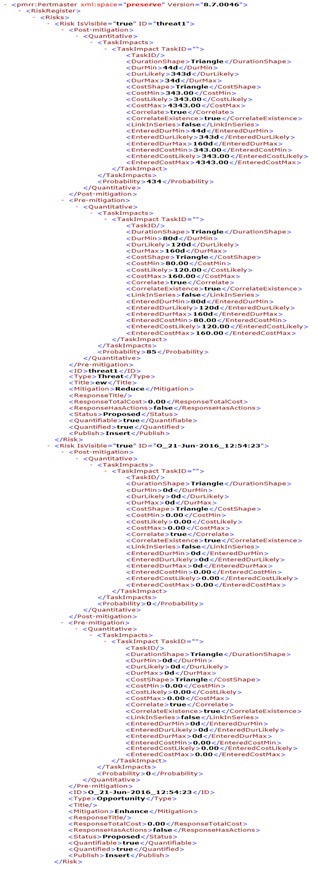
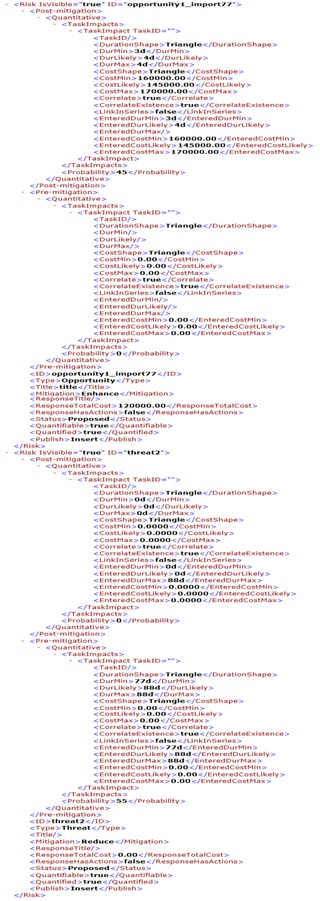
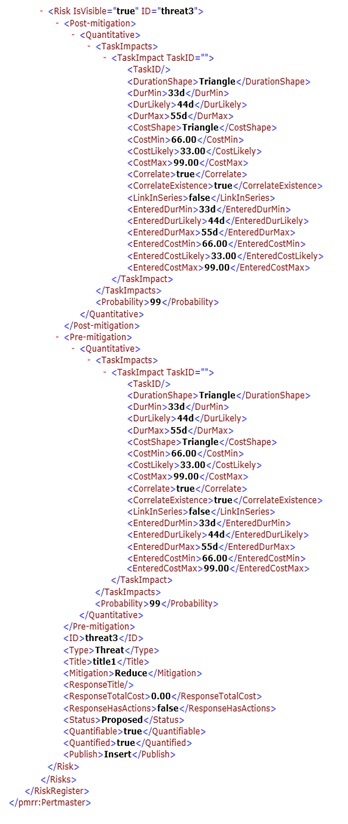
Figure 100
Audit Report – Threats:
The Audit Report page is used to track the value of Threat fields. This page helps to make a comparison of previous and present values of each field of Threat.
The entire page can be exported as a CSV file (Figure 101), which can be done by following the path below:
Risk Register —> Reports —>Audit Reports – Threats (CSV)
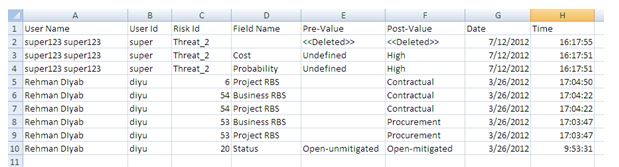
Figure 101
User Name and User ID correspond to the user who has modified the Threat/Opportunity value and the ID of that Threat/Opportunity under the Risk ID column. Pre-Value and Post-Value corresponds to the previous and present value of each field. The date and time of modification is mentioned in columns Date and Time respectively.
The entire page can be exported as a PDF file (Figure 102), which can be done by following the path below:
Risk Register —> Reports —>Audit Reports – Threats (PDF)
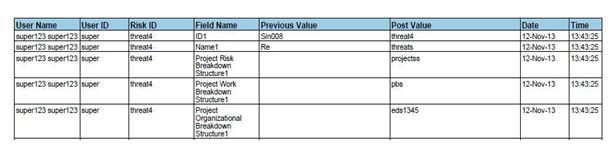
Figure 102
Audit Report – Opportunities:
The Audit Report page is used to track the value of Opportunity fields. This page helps to make a comparison of previous and present values of each field of Opportunity.
The entire page can be exported as a CSV file (Figure 103), which can be done by following the path below:
Risk Register —> Reports —>Audit Reports – Opportunities (csv)
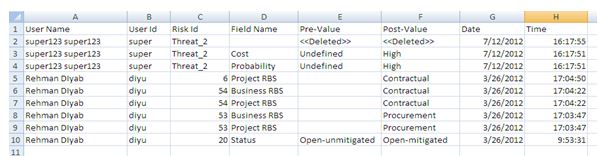
Figure 103
User Name and User ID correspond to the user who has modified the Threat/Opportunity value and the ID of that Threat/Opportunity under the Risk ID column. Pre-Value and Post-Value corresponds to the previous and present value of each field. The date and time of modification is mentioned in columns Date and Time respectively.
The entire page can be exported as a PDF file (Figure 104), which can be done by following the path below:
Risk Register —> Reports —>Audit Reports – Opportunities (pdf)
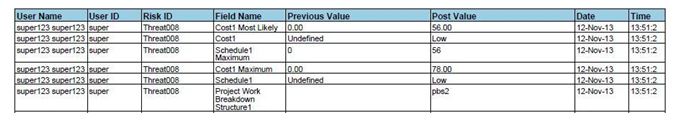
Figure 104
Audit Report – Mitigation:
The Audit Report page is used to track the value of Mitigation fields. This page helps to make a comparison of previous and present values of each field of Mitigation.
The entire page can be exported as a CSV file (Figure 105), which can be done by following the path below:
Risk Register —> Reports —>Audit Reports – Mitigation
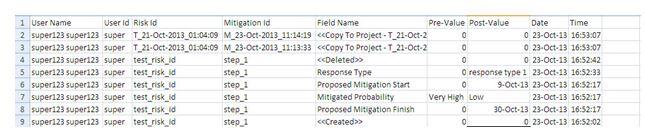
Figure 105
User Name and User ID correspond to the user who has modified the Threat/Opportunity value and the ID of that Threat/Opportunity under the Risk ID column. Pre-Value and Post-Value corresponds to the previous and present value of each field. The date and time of modification is mentioned in columns Date and Time respectively.
The entire page can be exported as a PDF file (Figure 106), which can be done by following the path below:
Risk Register —> Reports —>Audit Report – Mitigation
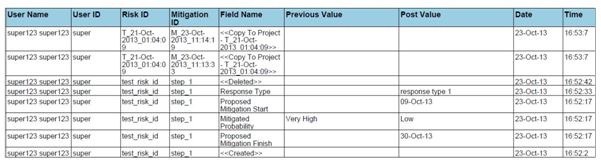
Figure 106
- Mitigation Started Late (Days)