The Standard Reports (Portfolio) page allows the user to create various reports such as: Threat Reports, Opportunity Reports, Mitigation Reports, Other Risk Reports and Exports. The process to create a report is broken down into steps to make it easier for users to follow. Reports from this page can be added to the Manager’s Dashboard for further analysis and reporting. This page can be viewed by only those users who have either Read/Write or View access.

Figure 1
Set as Default Chart Icon:
Set as Default Icon is used to set any chart as the landing page when we select Reports of Portfolio Management. Risk score is the chart to appear first by default. (Figure 1)
Reports:
There are several types of reports in the Standard Report (Portfolio) page. In order to generate a chart, the primary option that should be selected is Report. The Report selected by default (while the page is loaded) is Threat Reports. Figure 2 shows the various types of available reports.

Figure 2
Report Option:
The Report option decides for which risk type the chart should be generated. The risk type listed will vary for the Status Reports. For all other reports it remains the same. The report option for all reports is shown in Figure 3, Figure 4, Figure 5 and 6.
The report option for threat and opportunity are Threat Tornado, Opportunity Tornado, Threat Exposure Over Time, Opportunity Exposure Over Time, Threat Qualitative Exposure Pie Chart, Opportunity Qualitative Exposure Pie Chart, Threat Simulation Exposure Pie Chart and Opportunity Simulation Exposure Pie Chart.
Risk Tornado Charts:

Figure 3
Risk Exposure Charts:

Figure 4
Risk Exposure Pie Charts:

Figure 5
Status Charts:

Figure 6
Data Option:
Data Option includes additional impacts if any.
The various data options available are:
- Risk Score
- Qualitative Cost
- Qualitative Schedule
- Other Qualitative impacts
- Qualitative Probability
- Simulation Cost
- Simulation Schedule
- Simulation Probability
- Simulation Cost Exposure
- Qualitative Cost Exposure
- Simulation Schedule Exposure

Figure 7
Risk Score:
The Risk Score for Threat/Opportunity is the pre-mitigated score. The Risk Score for mitigation is the post-mitigated score.
Qualitative Cost:
The formulas for Qualitative Cost are:
1. [(Qualitative Cost Upper Limit + Qualitative Cost Lower Limit) / 2] (Pre-Value)
2. [(Qualitative Mitigation Cost Upper Limit + Qualitative Mitigation Cost Lower Limit) / 2] (Post-Value)
If there is no upper limit: Qualitative Cost = lower limit * 1.5
If there is no lower limit: Qualitative Cost = upper limit / 2
Qualitative Schedule:
The formulas for Qualitative schedule are:
1. [(Qualitative Schedule Upper Limit + Qualitative Schedule Lower Limit) / 2] (Pre-Value)
2. [(Qualitative Mitigation Schedule Upper Limit + Qualitative Mitigation Schedule Lower Limit) / 2] (Post-Value)
If there is no upper limit: Qualitative Schedule = lower limit * 1.5
If there is no lower limit: Qualitative Schedule = upper limit / 2
Other Qualitative Impacts:
The formulas for Additional Impacts are:
1. [(Qualitative Additional Impact Upper Limit + Qualitative Additional Impact Lower Limit) / 2] (Pre-Value)
2. [(Qualitative Mitigation Additional Impact Upper Limit + Qualitative Mitigation Additional Impact Lower Limit) / 2] (Post Value)
If there is no upper limit Average value = lower limit * 1.5
If there is no lower limit Average value = upper limit / 2
Qualitative Probability:
The formulas for Qualitative Probability are:
1. [[(Qualitative Probability Upper Limit + Qualitative Probability Lower Limit) / 2 ]] (Pre-Value)
2. [[(Qualitative Mitigation Probability Upper Limit + Qualitative Probability Lower Limit) / 2]] (Post-Value)
If there is no upper limit: Qualitative Probability = [(lower-limit + 100) / 2]
If there is no lower limit: Qualitative Probability = [(0 + upper-limit) / 2]
Simulation Cost:
The formulas for Simulation Cost are:
1. [(Cost min + Cost max + 4 * (Cost Most likely)) / 6] (Pre Value)
2. [(Mitigation Cost min + Mitigation Cost max + 4 * ( Mitigation Cost Most likely)) / 6] (Post Value)
If there is no max then max = min * 2
If there is no min then min = max / 2
If there is no most likely then Avg = [(Min + Max) / 2]
Simulation Schedule:
The formulas for Simulation Schedule are:
1. [(Schedule min + Schedule max + 4 * ( Schedule Most likely)) / 6] (Pre-Value)
2. [(Mitigation Schedule min + Mitigation Schedule max + 4 * ( Mitigation Schedule Most likely)) / 6] (Post-Value)
If there is no max then max = min * 2
If there is no min then min = max / 2
If there is no most likely then Avg = [(Min + Max) / 2]
Simulation Probability:
The formulas for Simulation Probability are:
1. [[Simulation Probability Percentage]] (Pre-Value)
2. [[Mitigation Simulation Probability]] (Post-Value)
Simulation Cost Exposure:
The formulas for Simulation Cost Exposure are:
1. [(Simulation Cost * Simulation Probability) / 100] (Pre-Value)
2. [(Mitigation Simulation Cost * Mitigation Simulation Probability) / 100] (Post-Value)
Simulation Schedule Exposure:
The formulas for Simulation Schedule Exposure are:
1. [(Simulation Schedule * Simulation Probability) / 100] (Pre-Value)
2. [(Mitigation Simulation Schedule * Mitigation Simulation Probability) / 100] (Post-Value)
The various data options for Threat Qualitative Exposure Pie Chart,Opportunity Qualitative Exposure Pie Chart,Threat Simulation Exposure Pie Chart and Opportunity Simulation Exposure Pie Chart are:
- Project-OBS
- Project-WBS
- Project-RBS
- Business Unit-OBS
- Business Unit-WBS
- Business Unit-RBS
- Enterprise-OBS
- Enterprise-WBS
- Enterprise-RBS
- Risk Owner
Project OBS, Project WBS and Project RBS details are added from the page Project Breakdown Structure (Project Settings —> Project Breakdown Structure)
Business OBS, Business RBS, Business WBS, Enterprise OBS, Enterprise RBS, and Enterprise WBS are added from the page Manage Breakdown Structure (Portfolio Management —> Manage Breakdown Structure)
From the Select box (Figure 8) there is an option to select either Pre-Mitigated/Post-Mitigated or Pre-Mitigated & Post-Mitigated. This option is hidden for status charts. For Risk Threat Tornado, Opportunity Tornado, Threat Exposure Over Time, Opportunity Exposure Over Time it is shown in Figure 8(a), and for Threat Qualitative Exposure Pie Chart,Opportunity Qualitative Exposure Pie Chart,Threat Simulation Exposure Pie Chart and Opportunity Simulation Exposure Pie Chart it is shown in Figure 8(b).


Figure 8(b)
Filter:
This functionality is used to apply a Filter to the chart.
Steps:
-
Portfolio Management—> Reports
-
Click the FILTER SETTINGS button. (Figure 9) The pop up shown in Figure 10 appears.
-
Select the field from the Select Field dropdown. (Figure 10)
-
Select the Operator from the Select Operator dropdown. (Figure 10) The various fields and the operators applicable are shown in Table 1.
-
The User can select values or enter values from the Select Value dropdown. (Figure 10)
-
Click the ADD FILTER OPTION button to add another filter. (Figure 10)
- Click the APPLY FILTER button to view the filtered report or give Name, Description and Global Access option and then click the SAVE AND APPLY FILTER button to view the saved filter report. (Figure 10)
- Select the filter name from the Name dropdown and click the Delete icon that appears, to delete that particular saved filter. (Figure 10)

Figure 9
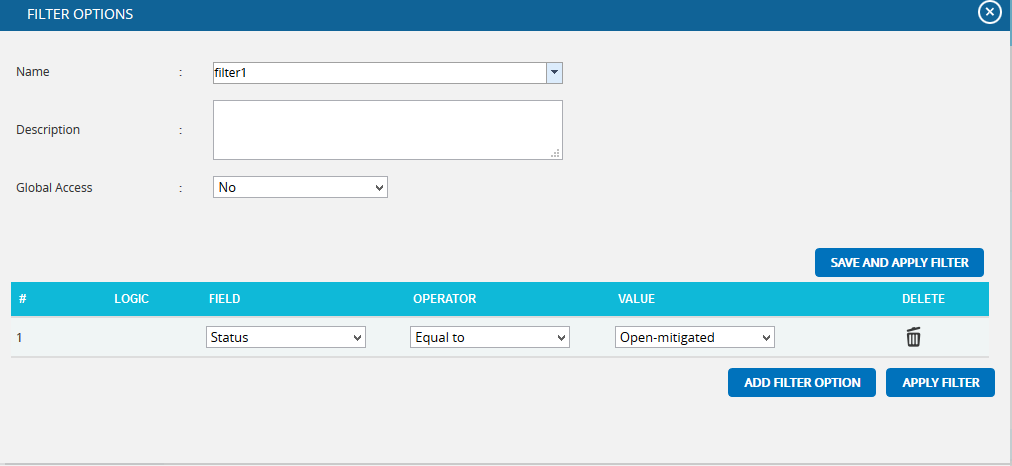
Figure 10
|
Field Type |
Operator | Notes |
| Text | Equal to | User types text-This chart contains all the values that match the text exactly. |
| Contains | User types text-This chart contains all the values that contain the text anywhere in the string. | |
| Not equal to | User types text-This chart contains all the values that do not match exactly. | |
| Does not contain | User types text-This chart contains all values where the text is not contained anywhere in the string. | |
| Date | Equal to | Date pop up box-This chart contains all values where the date matches exactly. |
| Before | Date pop up box-This chart contains all values where the date is before the selected date. | |
| After | Date pop up box-This chart contains all values where the date is after the selected date. | |
| Not equal to | Date pop up box-This chart contains all values where the date does not match exactly. | |
| Number | Equal to | User enters number-This chart contains all values which match exactly with the number entered. |
| Greater than | User enters number-This chart contains all values greater than the number entered. | |
| Greater than or Equal to | User enters number-This chart contains all values greater than or equal to the number entered. | |
| Less than | User entered number-This chart contains all values less than or equal to the number entered. | |
| Less than or equal to | User enters number-This chart contains all values less than the number entered | |
| Not equal to | User enters number-This chart contains all values which are not the exact match for the number entered. | |
| WBS/OBS/RBS | Under | User selects WBS/OBS/RBS element via a check mark in a popup-All children under the node (and sub-nodes) are shown. If a user check marks Multiple Items, then an OR is applied to all check-marked items. |
| Not Under | User selects WBS/OBS/RBS element via a check mark in a popup-All items are shown except children under the node (and sub-nodes). | |
| List Items (such as status) | Equal to | User selects list element from a dropdown box-This chart will contain all the values which match the selected value exactly. |
| Equal to (select multiple) | User selects list element via a check mark in a popup-If a user check marks multiple items, then an OR is applied to all checked items. This chart will contain all values which match the selected values exactly. | |
| Not equal to | User selects list element from a dropdown box-This chart contains all values not equal to the selected value | |
| Contains | User selects list element from a dropdown box-This chart contains all values which contain the selected value | |
| Not equal to (select multiple) | User selects list element via a check mark in a popup-If the user checks multiple items an OR is applied to all checked items, and the results will not be equal to any checked items. This chart contains all values not equal to the selected values |
Table 1
Risk Tornado Chart:
Tornado Diagrams, also called Tornado Plots or Tornado Charts, are special types of Bar Charts where the data categories are listed vertically. These charts are generated by default when the Standard Reports (Portfolio) page is initially loaded. The Post-Mitigated score is the Mitigation score and Pre-Mitigated score is the Risk score.
Threat Tornado:
The Threat Tornado chart corresponds to all threats of the projects to which the logged in user has access.
Steps:
-
Portfolio Management —> Reports
-
Click the Threat Reports link to select Threat Tornado Chart. (Figure 1)
-
Select Pre-Mitigated to view Pre-Mitigated data (sorted by Pre-Mitigated), Post-Mitigated to view Post-Mitigated data (sorted by Post-Mitigated) or Both, and to view both Pre-Mitigated data and Post-Mitigated data from the dropdown. (Figure 9)
-
Click the FILTER SETTINGS button to add a filter. (Steps to be followed to add a filter are explained in Filter section above). (Figure 9)
-
Click the Risk Score link or any other data option to generate the report. (Figure 11) The chart generated and the data table are shown below in Figure 12.

Figure 11

Figure 12
Opportunity Tornado:
The Opportunity Tornado chart corresponds to all the opportunities of the projects to which the logged in user has access.
Steps:
-
Portfolio Management —> Reports
-
Click the Opportunity Reports link to select Opportunity Tornado Chart. (Figure 1)
-
Select Pre-Mitigated to view Pre-Mitigated data only (sorted by Pre-Mitigated), Post-Mitigated to view Post-Mitigated data (sorted by Post-Mitigated) or Both, and to view both Pre-Mitigated data and Post-Mitigated data from the dropdown. (Figure 9)
-
Click the FILTER SETTINGS button to add a filter. (Steps to be followed to add a filter are explained in filter section above). (Figure 9)
-
Click the Risk Score link or any other data option to generate the report. (Figure 13) The chart generated and the data table is shown is in Figure 14.

Figure 13

Figure 14
Clicking on the Risk ID shown in the data table in figure 14 navigates to the page:
Risk Register —> Risk Details (Opportunity)
Status:
The Status chart is represented by a pie chart and corresponds to the status assigned to the risk.
Steps:
- Portfolio Management —> Reports
- Click the FILTER SETTINGS button to add a filter. (Steps to be followed to add a filter are explained in the filter section above). (Figure 9)
- Click the Status —> Threat Status link under Threat reports to know the status of threats in the selected project. Click the Status —> Opportunity Status link under Opportunity reports to know the status of opportunity in the selected project. To know the status of mitigations in the selected project, click Status —> Mitigation Status link. Click the Threat and Opportunity Status link under Other Risk Reports to know the status of threats and opportunities in the selected project. (Figure 15) The chart generated and the data table is shown is in Figure 16.

Figure 15

Figure 16
The count under the Number column shown in Figure 16 has a link to the Threat Tornado chart. (Figure 12)
Threat Exposure Over Time:
The Threat Exposure Over Time chart is generated based on the qualitative cost exposure, simulation cost exposure, qualitative schedule exposure and simulation schedule exposure for all the threats of the projects to which the logged in user has access.
Steps:
-
Portfolio Management —> Reports
-
Click the Exposure Over Time link under Threat Reports. (Figure 1)
-
Select Pre-Mitigated to view Pre-Mitigated data only (sorted by Pre-Mitigated), Post-Mitigated to view Post-Mitigated data (sorted by Post-Mitigated) or Both, and to view both Pre-Mitigated data and Post-Mitigated data from the dropdown. (Figure 9)
-
Click the FILTER SETTINGS button to add a filter. (Steps to be followed to add a filter are explained in filter section above). (Figure 9)
-
Click the Cost Exposure Under Simulation to or any other data option to generate the report. (Figure 17) The chart generated and the data table is shown is in Figure 18.

Figure 17

Figure 18
The Column Date of the data table (Figure 18) contains a link that navigates the user to the following charts:
- Simulation Cost Exposure Tornado (Threat) if the option “Cost Under Simulation For Threat Reports” link is selected.
- Qualitative Cost Exposure Tornado (Threat) if the option “Cost Under Qualitative For Threat Reports” link is selected.
- Simulation Schedule Exposure Tornado (Threat) if the option “Schedule Under Simulation For Threat Reports” link is selected.
- Qualitative Schedule Exposure Tornado (Threat) if the option “Schedule Under Qualitative For Threat Reports” link is selected.
Opportunity Exposure Over Time:
The Opportunity Exposure Over Time chart is generated based on the qualitative cost exposure, simulation cost exposure, qualitative schedule exposure and simulation schedule exposure for all opportunities on all projects to which the user has access.
Steps:
-
Portfolio Management —> Reports
-
Click the Exposure Over Time link under Opportunity Reports. (Figure 1)
-
Select Pre-Mitigated to view Pre-Mitigated data only (sorted by Pre-Mitigated), Post-Mitigated to view Post-Mitigated data (sorted by Post-Mitigated) or Both, and to view Pre-Mitigated data and Post-Mitigated data from the dropdown. (Figure 9)
-
Click the FILTER SETTINGS button to add a filter. (Steps to be followed to add a filter are explained in filter section above). (Figure 9)
-
Click the Cost Exposure Under Simulation or any other data option to generate the report. (Figure 19) The chart generated and the data table is shown in Figure 20.

Figure 19

Figure 20
The Column Date of the data table (Figure 20) contains a link that navigates the user to the following charts:
- Simulation Cost Exposure Tornado (Opportunities) if the option “Cost Under Simulation For Opportunity Reports” is selected.
- Qualitative Cost Exposure Tornado (Opportunities) if the option “Cost Under Qualitative For Opportunity Reports” is selected.
- Simulation Schedule Exposure Tornado (Opportunities) if the option “Schedule Under Simulation For Opportunity Reports” is selected.
- Qualitative Schedule Exposure Tornado (Opportunities) if the option “Schedule Under Qualitative For Opportunity Reports” is selected.
Threat Simulation Exposure Pie Chart:
Threat Simulation Exposure Pie Chart depends on the simulation cost exposure of the threats mapped to the break down structure of all the projects the logged in user has access.
Steps:
-
Portfolio Management —> Reports
-
Click the Exposure Pie Chart link under Threat Reports. (Figure 1)
-
Select Pre-Mitigated to view Pre-Mitigated data only (sorted by Pre-Mitigated), Post-Mitigated to view Post-Mitigated data (sorted by Post-Mitigated) from the dropdown. (Figure 9)
-
Click the FILTER SETTINGS button to add a filter. (Steps to be followed to add a filter are explained in the filter section above). (Figure 9)
-
Click the Project-WBS link or any other data option to generate the report. (Figure 21) The chart generated and the data table is shown in Figure 22.

Figure 21

Figure 22
The Name column contains a link to WBS Tornado (Threats). (Figure 22)
Opportunity Simulation Exposure Pie Chart:
The Opportunity Simulation Exposure Pie Chart depends on the simulation cost exposure of the opportunities mapped to the break down structure for all the projects to which the user has access.
Steps:
-
Portfolio Management —> Reports
-
Click the Exposure Pie Chart link under Opportunity Reports. (Figure 1)
-
Select Pre-Mitigated to view Pre-Mitigated data only (sorted by Pre-Mitigated), Post-Mitigated to view Post-Mitigated data (sorted by Post-Mitigated) from the dropdown. (Figure 9)
-
Click the FILTER SETTINGS button to add a filter. (Steps to be followed to add a filter are explained in filter section above). (Figure 9)
-
Click the Project-WBS link or any other data option to generate the report. (Figure 23) The chart generated and the data table is shown in Figure 24.

Figure 23

Figure 24
The Name column contains a link to the WBS Tornado (Opportunities). (Figure 24)
Threat Qualitative Exposure Pie Chart:
Threat Qualitative Exposure Pie Chart depends on the qualitative cost exposure of the threats mapped to the break down structure for all the projects the logged in user has access.
Steps:
-
Portfolio Management —> Reports
-
Click the Exposure Pie Chart link under Threat Reports. (Figure 1)
-
Select Pre-Mitigated to view Pre-Mitigated data only (sorted by Pre-Mitigated), and Post-Mitigated to view Post-Mitigated data (sorted by Post-Mitigated) from the dropdown. (Figure 9)
-
Click the FILTER SETTINGS button to add a filter. (Steps to be followed to add a filter are explained in filter section above) (Figure 9)
-
Click the Project-WBS link or any other data option to generate the report. (Figure 25) The chart generated and the data table is shown in Figure 26.

Figure 25

Figure 26
The Name column contains a link to the WBS Tornado (Threats). (Figure 26)
Opportunity Qualitative Exposure Pie Chart:
Steps:
-
Portfolio Management —> Reports
-
Click the Exposure Pie Chart link under Opportunity Reports (Figure 1)
-
Select Pre-Mitigated to view Pre-Mitigated data only (sorted by Pre-Mitigated), and Post-Mitigated to view Post-Mitigated data (sorted by Post-Mitigated) from the dropdown. (Figure 9)
-
Click the FILTER SETTINGS button to add a filter. (Steps to be followed to add a filter are explained in filter section above). (Figure 9)
-
Click the Project-WBS link or any other data option to generate the report. (Figure 27) The chart generated and the data table is shown in Figure 28.

Figure 27

Figure 28
The Name column contains a link to WBS Tornado (Threats). (Figure 28)
Email Settings:
This functionality is used to export the entire page to word and send mail to the person selected. The functionality consists of two lists, Available Users and Selected Users. Available Users (Figure 29) contains all the portfolio level users. Selected Users (Figure 29) displays the users who have been selected. A user can be added to the Selected Users list using the Add button. All users under the Available Users list can be moved to the Selected Users list using the Add All button. (Figure 29) A single user from the Selected Users list can be moved back to the Available Users list using the Remove button. The Remove All button moves all users from the Selected Users list to the Available Users list. The Subject by default has the value Chart Title, which can be changed if needed.
Steps:
-
Portfolio Management —> Reports
-
Generate the desired report by clicking on the type of reports provided to the left.
-
Click the Email icon to send email.
-
Select at least one user to whom mail should be sent.
-
Enter the message in the Message text area.
-
Click the SEND MESSAGE button to finish. (Figure 29) To cancel, click the CANCEL button. (Figure 29)

Figure 29
Chart Settings:
This functionality is used to modify the color of the charts generated and also to create and save the editable chart settings and report script. The accessibility of these chart settings is different for different users.
- Users with global access Read/Write option – The editable dropdown has all the global shared chart settings as well as those shared at the personal level. Global access saved name cannot be edited at the global level.
- Users with global access Read only (view only) option – The editable dropdown has all the global shared chart settings as well as those shared at the personal level. The saved name stores only to the personal level, no other users can view that name.
- Users with global access No access option – The editable dropdown has only the chart settings saved at the personal level. The saved name stores only to the personal level, no other users can view that name.
Each chart has its own color setting.
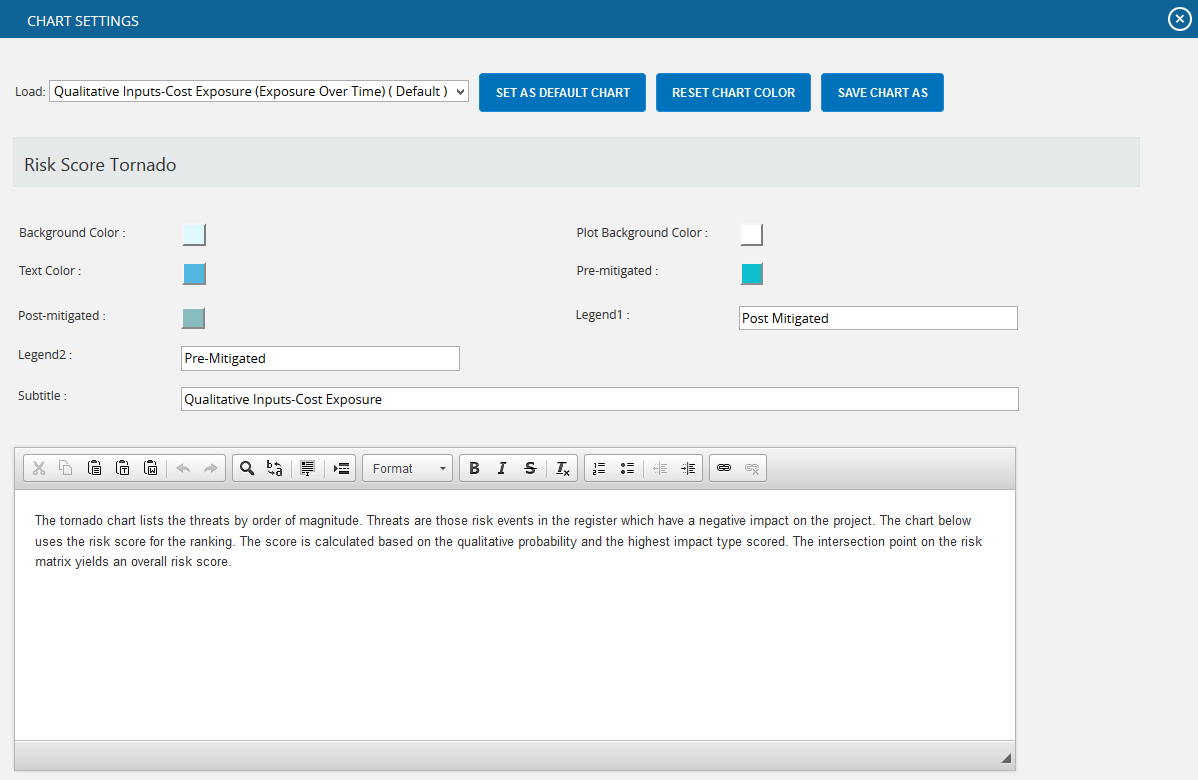
The color is set by clicking on the corresponding color shown beside each field. An example of the color picker for various fields is shown in Figure 31.

Figure 31
In Tornado charts, user can set the Y-axis as a combination of project and risk details. By default the Y-axis is Project Id – Risk Id value. User can select either of it as <<None>> but not both as shown in Figure 32.
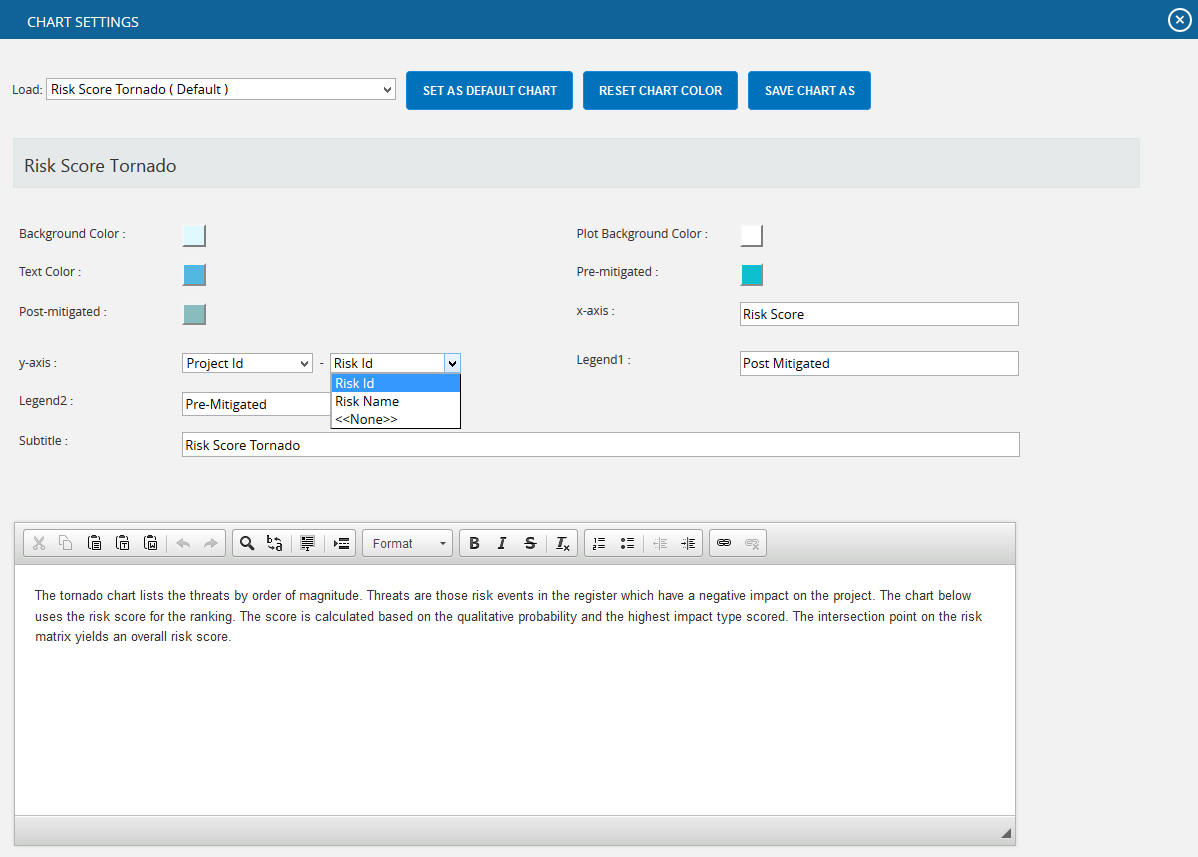
Figure 32
Edit Color:
Steps:
- Portfolio Management —> Reports
- Click the CHART SETTINGS button to go to chart settings page. (Figure 1)
- Modify the colors needed.
Save As:
This functionality is used to save the user editable chart settings globally or locally with a name and description.
Steps:
- Portfolio Management –> Reports
- Click the CHART SETTINGS icon to go to the chart settings page. (Figure 1)
- Edit the report script and chart settings and click SAVE AS button. (Figure 30)
- Give the name and description to save and also give the global access option in the pop up appears. (Figure 33)
- Click the SAVE button. (Figure 33)
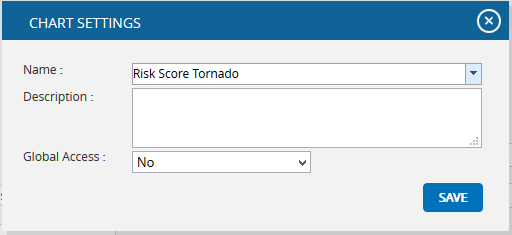
Figure 33
Set As Default Chart:
This functionality is used to set the selected chart settings name, as the default chart.
Steps:
- Portfolio Management –> Reports
- Click the CHART SETTINGS icon to go to the chart settings page. (Figure 1)
- Select a name from the Load dropdown. (Figure 30)
- Click the SET AS DEFAULT button to set the selected chart as default. (Figure 30)
Delete:
This functionality is to delete the selected chart settings name from the Load dropdown. This button appears only for the created users. The default chart settings name cannot be deleted by any user.
Steps:
- Portfolio Management –> Reports
- Click the CHART SETTINGS icon to go to the chart settings page. (Figure 1)
- Select a name from the Load dropdown. (Figure 30)
- Click DELETE button to delete.
Reset:
This functionality is used to reset all the values and report script of the chart to predefined values and script.
Steps:
- Portfolio Management —> Reports
- Click the CHART SETTINGS button to go to the chart settings page. (Figure 1)
- Click the RESET button to reset the values and report script. (Figure 30)
Add To Managers Dashboard:
This functionality is used to add the chart generated to the portfolio Manager´s Dashboard. A user with View access cannot add a chart to the Manager´s Dashboard.
Steps:
- Portfolio Management —> Reports
- Generate the desired report by clicking on the type of reports provided to the left.
- Click the SAVE AS NEW CHART button. (Figure 1) A pop up shown in figure 34 appears.
- Enter or select the Name and enter the Description.
- Click the SAVE button to finish. (Figure 34)
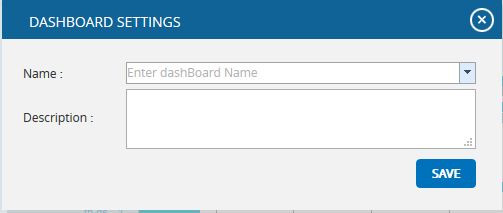
Figure 34
Export to Word:
This functionality is used to export the chart and data table generated to Word.
Steps:
- Portfolio Management —> Reports
- Generate the desired report by clicking on the type of reports provided to the left.
- Click the Export to Word link. (Figure 2)
Export to PowerPoint:
This functionality is used to export the chart generated to PowerPoint.
Steps:
- Portfolio Management —> Reports
- Generate the desired report by clicking on the type of reports provided to the left.
- Click the Export to PowerPoint link. (Figure 2)
Overall Risk Reports:

Figure 35
Riskiest Project Report:
The Riskiest Project Report page ranks all the projects in the database based on cost. Users can then view the projects by qualitative/simulation in separate charts and can be sorted by pre/post mitigated. When a link in the data table is clicked, a cost tornado chart for the selected project will be created.
- Portfolio Management —> Reports
- Click the Overall Risk Reports link to select Overall Risk Tornado Chart (Figure 2).
- Select the Qualitative Inputs or Simulation Inputs data options to view the charts based on qualitative or simulative inputs.
- Click the Riskiest Project Report (Figure 36).

Figure 36
Export to Word:
This functionality is used to export the entire page to word, and to perform this function, click the Export To Word link. (Figure 36)
Sort Data:
To Sort the data according to Project ID, Project Name, Pre-Mitigated Cost, Post-Mitigated Cost, consider the following steps;
Steps:
- Select the required column. (Figure 36)
- Select the order(Ascending/Descending) in which sorting is to be done. (Figure 36)
- Click the Sort button to sort the data. (Figure 36)
Links:
The column Pre-Mitigated Qualitative Cost has a link to the Qualitative Cost Tornado Chart (for Pre-Mitigated data) in the page:
Risk Register —> Reports —> Qualitative Cost Exposure Tornado (Pre-Mitigated)
The column Post-Mitigated Qualitative Cost has a link to the Qualitative Cost Tornado Chart (for Post-Mitigated data) in the page:
Risk Register —> Reports —> Qualitative Cost Exposure Tornado (Post-Mitigated)
The column Pre-Mitigated Simulation Cost has a link to the Simulation Cost Tornado Chart (for Pre-Mitigated data) in the page:
Risk Register —> Reports —> Simulation Cost Exposure Tornado (Pre-Mitigated)
The column Post-Mitigated Simulation Cost has a link to the Simulation Cost Tornado Chart (for Post-Mitigated data) in the page:
Risk Register —> Reports —> Simulation Cost Exposure Tornado (Post-Mitigated)
Cost Exposure Budget Ratio:
The Cost Exposure to Budget Ratio Tornado Chart shows the projects in the database based on cost exposure budget ratio that is the ratio which divides the cost exposure by the project budget from the project setup screen. There are Cost Exposure to Budget Ratio (Highs) chart for greatest percentage and Cost Exposure to Budget Ratio (Lows) for the lowest percentage. Users can view the projects by qualitative/simulation in separate charts. The projects listed are based on ascending order of Pre-Mitigated and Post-mitigated Qualitative Cost for Cost Exposure to Budget Ratio (Highs) and descending order of Pre-Mitigated and Post-mitigated Qualitative Cost for Cost Exposure to Budget Ratio (Lows).
Steps:
- Portfolio Management —> Reports
- Click the Overall Risk Reports link to select Overall Risk Tornado Chart (Figure 2).
- Select the Qualitative Inputs or Simulation Inputs data options to view the charts based on qualitative or simulative inputs.
- Click the Cost Exposure to Budget Ratio (Highs)/Cost Exposure to Budget Ratio (Lows). The chart will be displayed as shown in Figure 37.

Figure 37
Export to Word:
This functionality is used to export the entire page to word, and to perform this function, click the Export To Word link. (Figure 37)
Sort Data:
To Sort the data according to Project ID, Project Name, Pre-Mitigated Cost, Post-Mitigated Cost, consider the following steps;
Steps:
- Select the required column. (Figure 37)
- Select the order(Ascending/Descending) in which sorting is to be done. (Figure 37)
- Click the Sort button to sort the data. (Figure 37)
Links:
The column Pre-Mitigated Qualitative Cost has a link to the Qualitative Cost Tornado Chart (for Pre-Mitigated data) in the page:
Risk Register —> Reports —> Qualitative Cost Exposure Tornado (Pre-Mitigated)
The column Post-Mitigated Qualitative Cost has a link to the Qualitative Cost Tornado Chart (for Post-Mitigated data) in the page:
Risk Register —> Reports —> Qualitative Cost Exposure Tornado (Post-Mitigated)
The column Pre-Mitigated Simulation Cost has a link to the Simulation Cost Tornado Chart (for Pre-Mitigated data) in the page:
Risk Register —> Reports —> Simulation Cost Exposure Tornado (Pre-Mitigated)
The column Post-Mitigated Simulation Cost has a link to the Simulation Cost Tornado Chart (for Post-Mitigated data) in the page:
Risk Register —> Reports —> Simulation Cost Exposure Tornado (Post-Mitigated)
Bubble Chart:
Steps:
- Portfolio Management —> Reports
- Click the Overall Risk Reports link to select Bubble Chart. (Figure 2)
- Select the Qualitative Inputs or Simulation Inputs data options to view the charts based on qualitative or simulative inputs.
- Click the Cost Exposure to Budget Ratio (All). The chart will be displayed as shown in Figure 38.

Figure 38
Export to Word:
This functionality is used to export the entire page to word, and to perform this function, click the Export To Word link. (Figure 38)
Sort Data:
To Sort the data according to Project ID, Project Name, Pre-Mitigated Cost, Post-Mitigated Cost, consider the following steps;
Steps:
- Select the required column. (Figure 38)
- Select the order(Ascending/Descending) in which sorting is to be done. (Figure 38)
- Click the Sort button to sort the data. (Figure 38)
Links:
The column Pre-Mitigated Qualitative Cost has a link to the Qualitative Cost Tornado Chart (for Pre-Mitigated data) in the page:
Risk Register —> Reports —> Qualitative Cost Exposure Tornado (Pre-Mitigated)
The column Post-Mitigated Qualitative Cost has a link to the Qualitative Cost Tornado Chart (for Post-Mitigated data) in the page:
Risk Register —> Reports —> Qualitative Cost Exposure Tornado (Post-Mitigated)
The column Pre-Mitigated Simulation Cost has a link to the Simulation Cost Tornado Chart (for Pre-Mitigated data) in the page:
Risk Register —> Reports —> Simulation Cost Exposure Tornado (Pre-Mitigated)
The column Post-Mitigated Simulation Cost has a link to the Simulation Cost Tornado Chart (for Post-Mitigated data) in the page:
Risk Register —> Reports —> Simulation Cost Exposure Tornado (Post-Mitigated)
Keyword Report:
The Keyword Report searches all the projects in the database and shows the most frequently used word in the Threat/Opportunity Name and Threat/Opportunity Descriptive fields. When the user clicks on the keyword count, the report displays the projects and Threats/Opportunities with which it is associated.

Figure 39
Count link:
The Count link shows the project and Threat/Opportunity information for the selected keyword.
Threat ID link:
The link under Threat ID column navigates the user to the page:
Risk Register —> Risk Details —>Threats
Opportunity ID link:
The link under the Opportunity ID column navigates the user to the page:
Risk Register —> Risk Details —> Opportunity
Edit Omit Keywords:
This functionality is used to omit all keywords which the user does not want to be included in the Keyword Report page. To view the omitted keywords list, click the Edit Omit Keywords button. (Figure 39)
Add new word to Omitted List:
This functionality is used to add a new word to omitted words list.
Steps:
- Portfolio Management —> Reports
- Click the Keyword Report link under Other Risk Reports.
- Click the EDIT OMIT KEYWORDS button. (Figure 39) A pop up appears. (Figure 40)
- Click the ADD NEW button. (Figure 40)
- Enter the required word and click the SAVE button. (Figure 40)

Figure 40
Edit Omitted Words List:
The words shown in the omitted words list can be edited using this functionality.
Steps:
- Portfolio Management —> Reports
- Click the Keyword Report link under Other Risk Reports.
- Click the EDIT OMIT KEYWORDS button. (Figure 39) A pop up appears. (Figure 40)
- Click the EDIT button. (Figure 40)
- Modify the required words and click the SAVE button to finish. (Figure 40)
Delete Omitted Words:
This functionality is used to delete words from the omitted words list.
Steps:
- Portfolio Management —> Reports
- Click the Keyword Report link under Other Risk Reports.
- Click the EDIT OMIT KEYWORDS button. (Figure 39) A pop up appears. (Figure 40)
- Click the corresponding Delete icon to delete. (Figure 40)
Threat and Opportunity Status:

Figure 41
Net Risk Score Chart:
The Net Risk Score Chart shows the net risk score of all the impacts (cost, schedule, probability, etc) in the projects in the database. The top three impacts of the project are shown separately and all other impact scores are accumulated and shown in the other impacts. For each impact type, the scores will be sum of the values obtained from the corresponding Scoring Matrix of the Project. The chart shows either Post Mitigated or Pre Mitigated values according to the value selected in the dropdown. (Figure 42)
Steps:
- Portfolio Management —> Reports
- Click the Other Risk Reports link to select Net risk score Chart. (Figure 42)

Figure 42
Export to Word:
This functionality is used to export the entire page to word, and to perform this function, click the Export To Word link. (Figure 42)
Sort:
To Sort the data according to Pre-Mitigated Qualitative Cost, Post-Mitigated Qualitative Cost, consider the following steps;
Steps:
- Select the required column. (Figure 42)
- Select the order (Ascending/Descending) in which sorting is to be done. (Figure 42)
- Click the Sort button to sort the data. (Figure 42)
Filter:
Steps:
- Click the FILTER SETTINGS icon. (Figure 42) The pop up appears. (Figure 43)
- Select the impacts to be filtered by checking the checkboxes. (Figure 43)
- Click the LOAD IMPACT SCORES button to load the scores of filtered impacts. (Figure 43)

Figure 43
Links:
The impact links under the column Name of each project navigates the user to the page:
Risk Register –> Risk Spreadsheet –> Risk score (Pre-Mitigated) and (Post-Mitigated)
Refresh:
This functionality is used to refresh the page, click REFRESH button. (Figure 42)
Exports
The Exports functionality allows you to easily export project level data to MS Excel.

Figure 44
Export threat details:
This functionality is used to export the threat list of all projects assigned to the logged in user into MS Excel. A sample Excel sheet after export (only a few fields are shown) is illustrated in Figure 48.
Steps:
-
Portfolio Management —> Reports —> Exports
-
Click the Threat List link to export. (Figure 44)

Figure 45
Export opportunity details:
This functionality is used to export the opportunity list of all the projects assigned to the logged in user to MS Excel. A sample Excel sheet after export (only a few fields are shown) is illustrated in Figure 46.
Steps:
-
Portfolio Management —> Reports —> Exports
-
Click the Opportunity List link to export. (Figure 44)

Figure 46
Export mitigation details:
This functionality is used to export the mitigation list of all the projects assigned to the logged in user to MS Excel. A sample Excel sheet after export (only few fields are shown) including the mitigation details (for both threat and opportunity) is illustrated in Figure 47.
Steps:
-
Portfolio Management —> Reports —> Exports
-
Click the Mitigation List link to export. (Figure 44)

Figure 47
Export Mitigation Past Due details:
This functionality is used to export the mitigation past due list for all projects assigned to the logged in user to MS Excel. A sample sheet is shown (only a few fields are used) in Figure 49. The Number of Days column in the mitigation past due list is calculated as follows:
Number of Days = Current Date – Proposed Mitigation Finish
For example, consider the first row in Figure 49. The Proposed Mitigation Finish is 05/08/2011 and if the current date is 04/18/2012,
Number of days=346
Steps:
- Portfolio Management —> Reports —> Exports
- Click the Mitigation Past Due link to export. (Figure 44)

Figure 48
Export User Details:
This functionality is used to export the entire list of users assigned to the logged in user´s projects to MS Excel. The sample sheet shown in Figure 49 lists all the user details.
Steps:
- Portfolio Management —> Reports —> Exports
- Click the User List link to export. (Figure 44)

Figure 49
Export Project Details:
This functionality is used to export the entire list of projects assigned to the logged in user to MS Excel. The sample sheet shown in Figure 50 lists all the project details.
Steps:
-
Portfolio Management —> Reports —> Exports
-
Click the Project List link to export. (Figure 44)

Figure 50