Gantt charts are useful for planning and scheduling projects. They help to assess how long a project should take, determine the resources needed, and plan the order in which the user can complete tasks. They are also helpful for managing the dependencies between tasks.
The Gantt chart page contains two sections: Task details section and Gantt chart. The task details section shows all the tasks that are imported through the Import page. This section allows the user to add, edit or delete each task for those who have the Read/Write access to the page. The Gantt chart section provides the view to the Gantt chart generated on the task values.
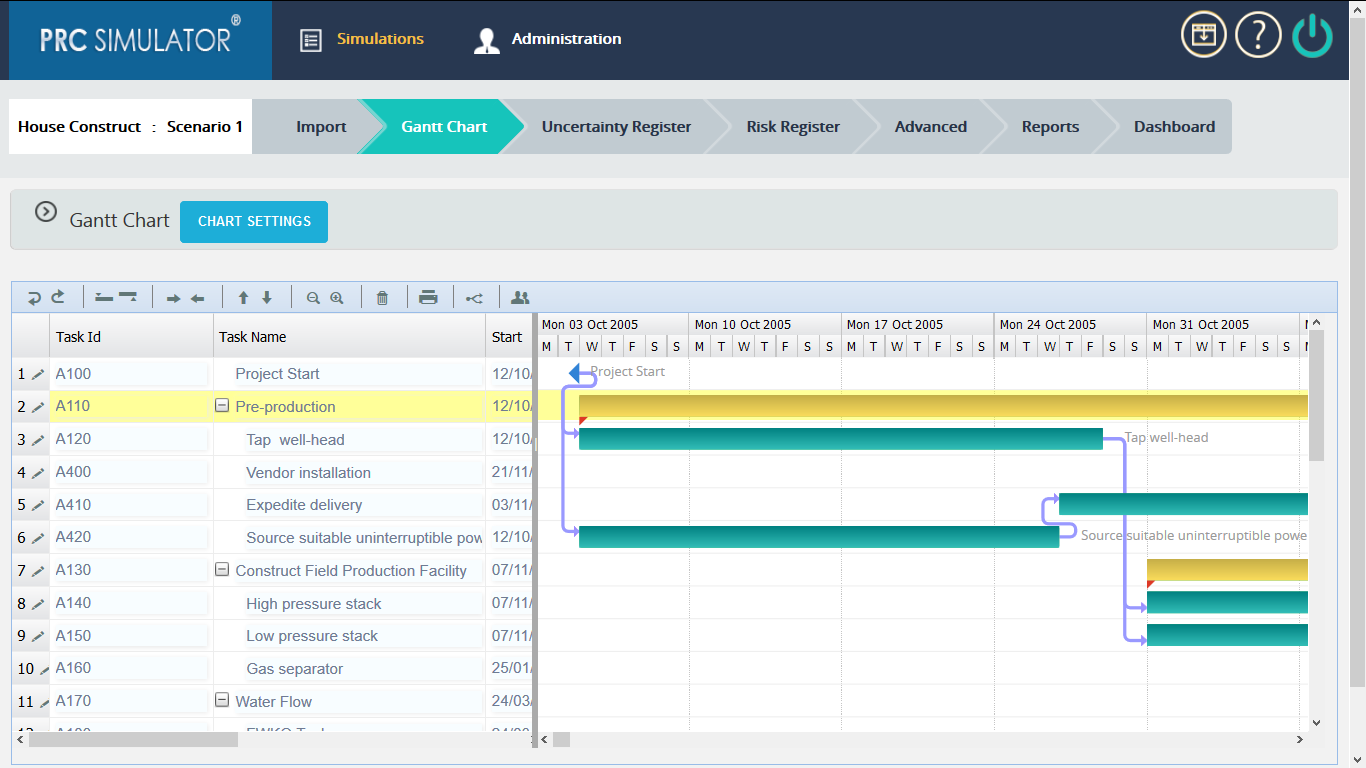
Figure 1
The duration in the task section is calculated by (Figure 2):
Duration = Finish Date – Start Date
If the user modifies the duration, according to which the Finish date is set. (Figure 2)
The Predecessors column shows the relationship between the tasks in the project. (Figure 2) There are 3 types of relationship between sequential tasks:
- FS (Finish to Start): If two tasks are in FS relation, then the second task can only be started after finishing the first.
- SS (Start to Start): If two tasks are in SS relation, then the second task can only be started after first task starts.
- FF (Finish to Finish): If two tasks are in FF relation, then the second task cannot be end before the first task ends.
A fourth type, SF (Start to Finish) is very rare.
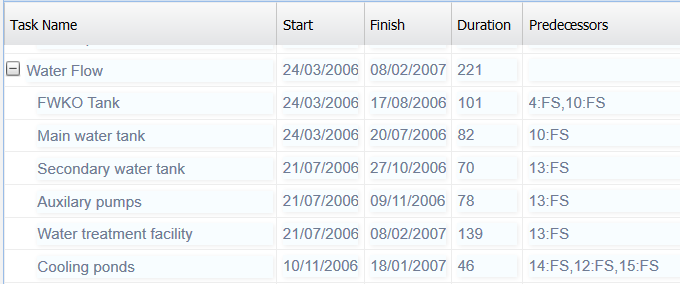
Figure 2
In Figure 2, the Predecessors column value 4: FS for a task shows that, the task has an FS relation with task in the 4th row.
2.2.1 Undo:
This functionality cancels the last change done to the task section. (Figure 3)
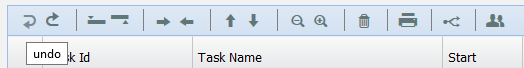
Figure 3
2.2.2 Redo:
This functionality repeats the last change done to the task section. (Figure 4)
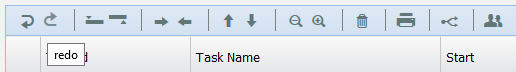
Figure 4
2.2.3 Insert Above:
This functionality helps to insert a new row above the selected row. (Figure 5)
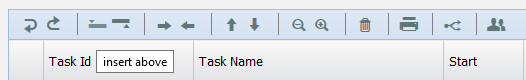
Figure 5
2.2.4 Insert Below:
This functionality helps to insert a new row below the selected row. (Figure 6)
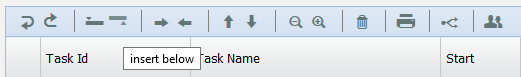
Figure 6
2.2.5 Move Up:
This functionality helps to move the selected row above one level. (Figure 7)
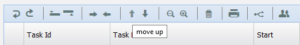
Figure 7
2.2.6 Move Down:
This functionality helps to move the selected row below one level. (Figure 8)
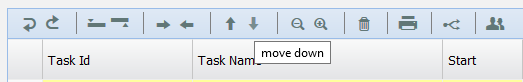
Figure 8
2.2.7 Delete:
This functionality helps to delete the selected row in the table. (Figure 9)
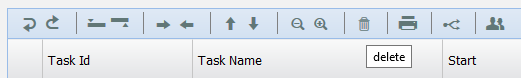
Figure 9
2.2.8 Critical Path:
The critical path is the sequence of tasks that will take the longest to complete to deliver the project. The user can click on the Critical Path icon (Figure 10) to view the critical path in the Gantt chart.
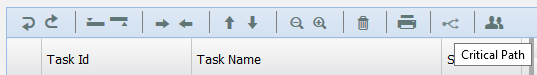
Figure 10
2.2.9 Edit Resources:
This functionality helps to edit all the resources available in the project. (Figure 11)

Figure 11
Steps:
- Simulation –> Gantt chart
- Click on Edit Resources icon. (Figure 11) A pop up appears.
- Give the required changes in the pop up. Click SAVE button to save. (Figure 12)
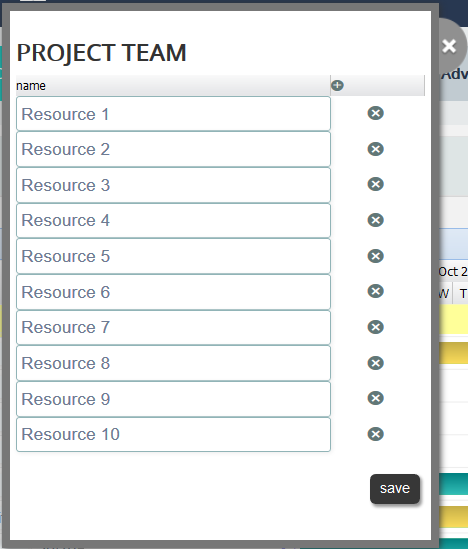
Figure 12
2.2.10 Edit Tasks:
This functionality helps to modify task in each row separately.
Steps:
- Simulation a Gantt chart
- Click in the EDIT icon corresponding to the row which is to be modified. (Figure 1) A pop up appears. (Figure 13)
- Give appropriate changes and click (Figure 13)
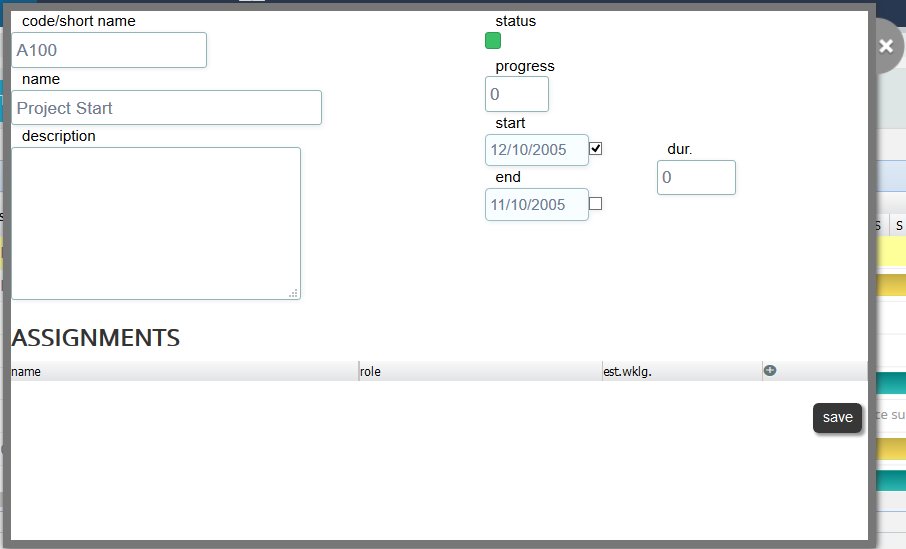
Figure 13