The Cost Estimate page shows all the task details of the imported project in a table format, along with the estimated cost values for each task in the project based on the import method (Simple Uncertainty/ Quantities and Rates / Multiple Resources). This page can be viewed in 2 sections; Group View and Resource View.
The Group View section helps the user to view the estimated cost values of each task in the project based on the basic identification information of each task, its resource details and the user defined fields. The default view is No grouping. (Figure 1)
Import 1 – Simple Uncertainty
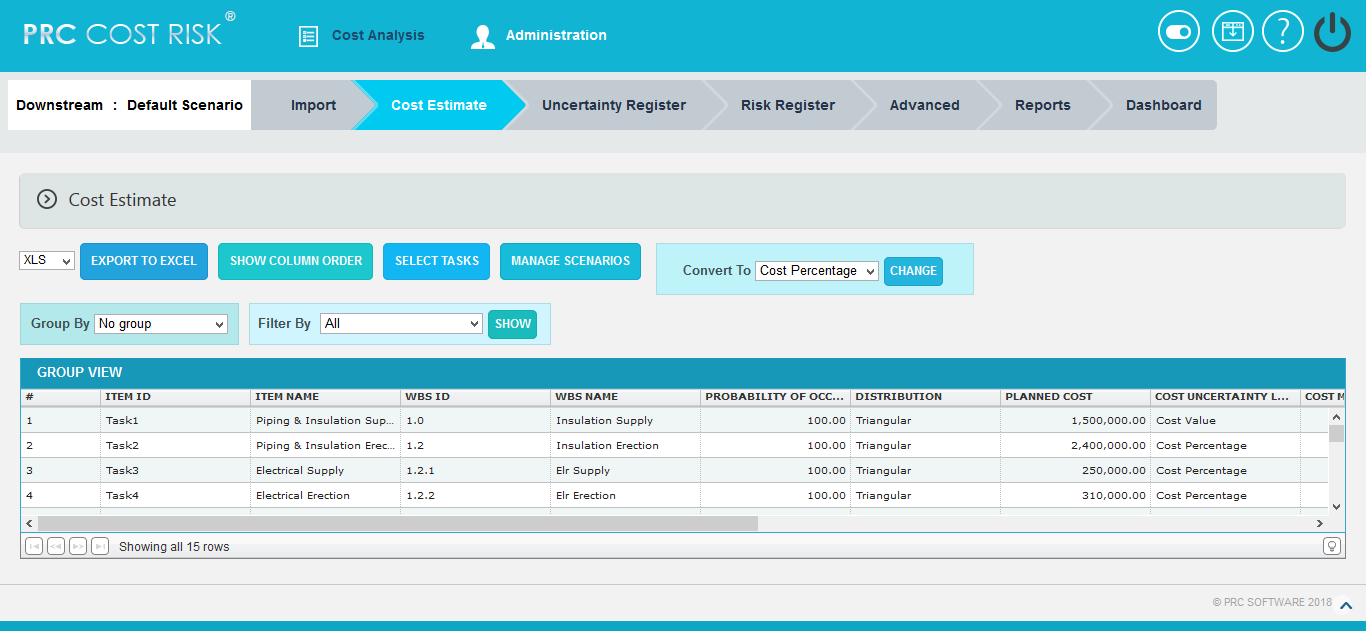
Figure 1
Import 2 – Quantities and Rates
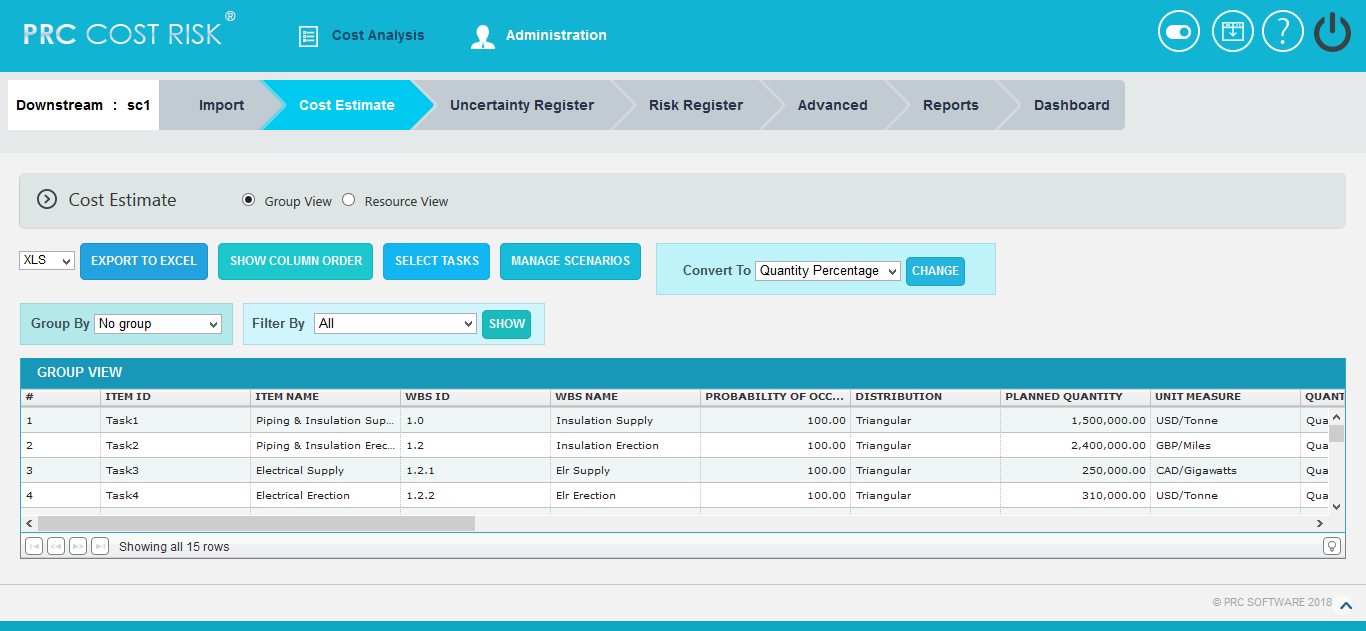
Figure 2
Import 3 – Multiple Resources
In the case of Multiple Resources, Group View section can be viewed in 2 ways: Top to Bottom or Left to Right. (Figure 3)
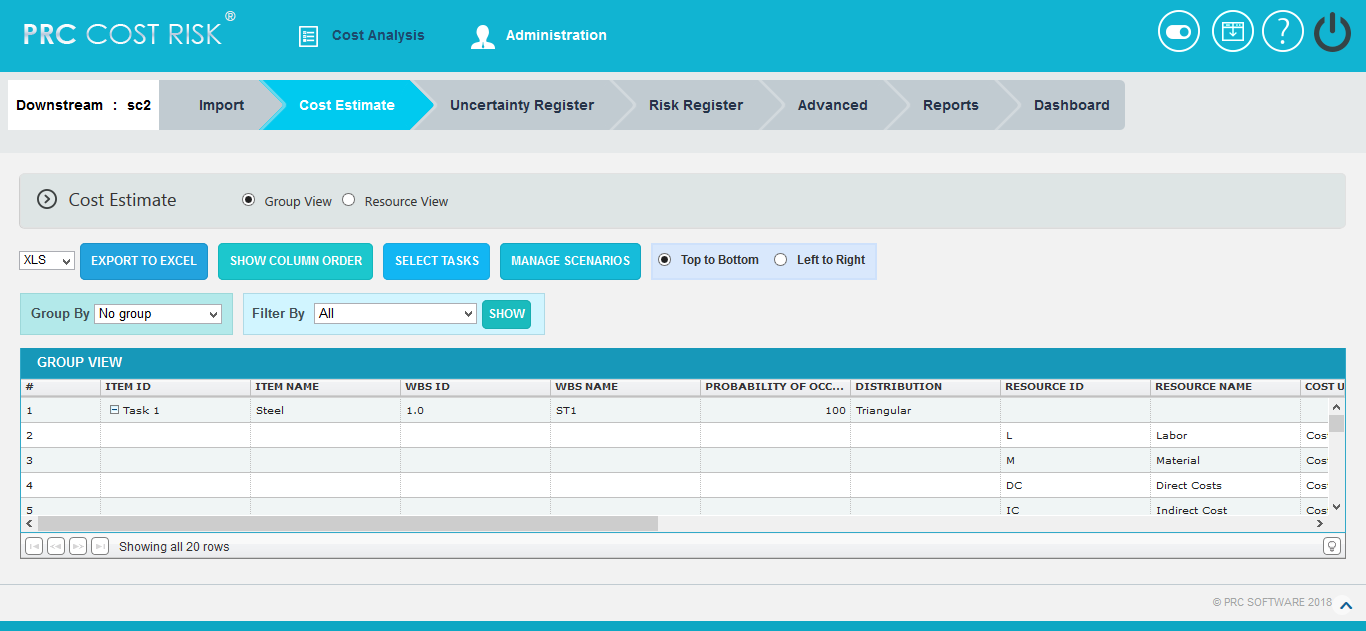
Figure 3
Show Column Order:
This functionality is used to reorder the task details columns under Group View.
Steps:
- Cost Analysis —> Cost Estimate —>Group View
- Click SHOW COLUMN ORDER. (Figure 3)
- Select the field to be reordered from Available Fields.
- Click First, Up, Down or Last button to move the selected field to the required position in the Group View table. (Figure 4)
- Click Save icon to save the changes done. (Figure 4)
- Click Reset icon to reset the fields to the previous positions. (Figure 4)
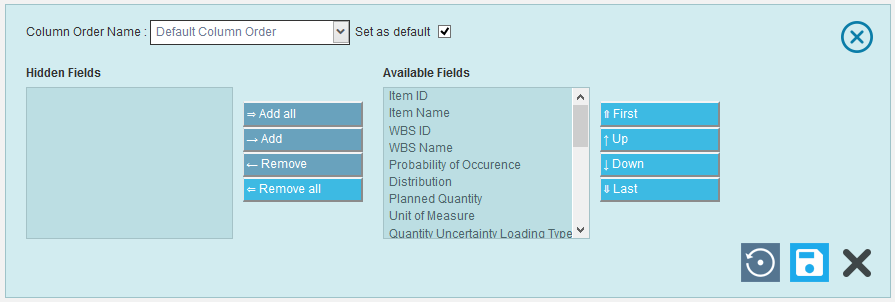
Figure 4
Hide or Show Columns:
This functionality is used to hide or show the task details columns in Group View table.
Steps:
- Cost Analysis —> Cost Estimate —>Group View
- Click SHOW COLUMN ORDER. (Figure 3)
- Select the field to hide or show in Group View table.
- Click Remove button to hide the selected field from Group View table, or click Add button to show in the table. (Figure 5)
- Click Remove All button to hide all the fields from the table, or click Add All button to show all the fields in the table. (Figure 5)
- Click Save icon to save the changes done. (Figure 5)
- Click Reset icon to reset the fields to the previous positions. (Figure 5)
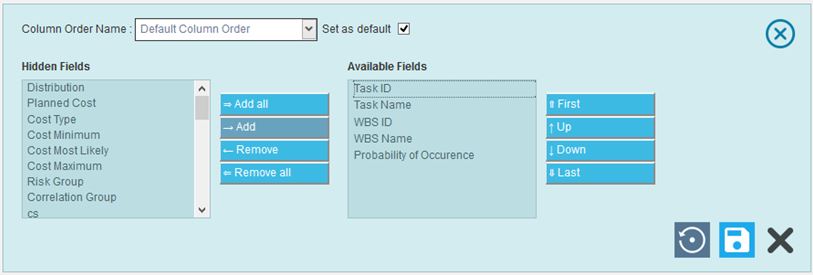
Figure 5
Filter Data:
This functionality is used to filter the data according to a particular field and its selected values.
Steps:
- Cost Analysis —> Cost estimate —> Group View
- Select the required column from the Filter by dropdown. (Figure 1)
- Enter the value in the textbox provided based on which filtering is to be done. (Figure 6) While giving conditions with select multiple option to filter, a pop up appears (Figure 7) where the multiple tasks can be selected.
- Click the SHOW button (Figure 6). The filtered data will be displayed.
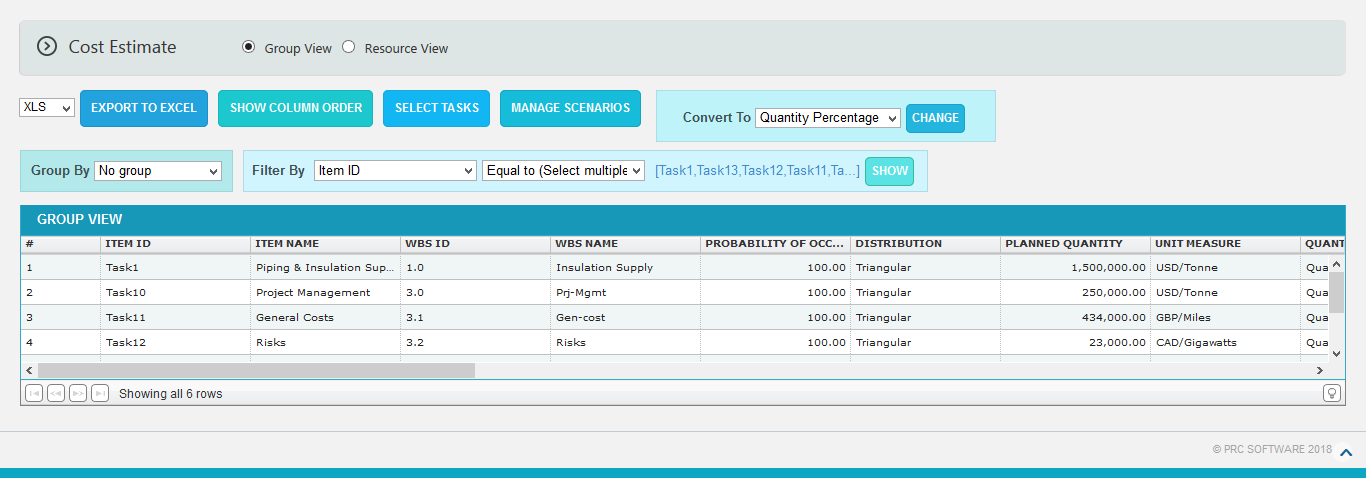
Figure 6
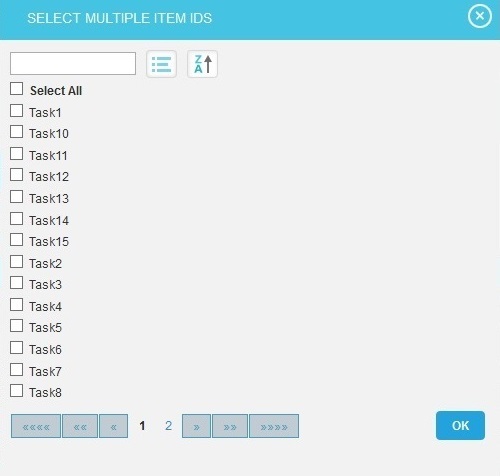
Figure 7
Group By:
This functionality is used to group the column values based on a particular field.
Steps:
- Cost Analysis —>Cost Estimate —>Group View
- Click Group By dropdown and select the required group to view the tasks. (Figure 5)
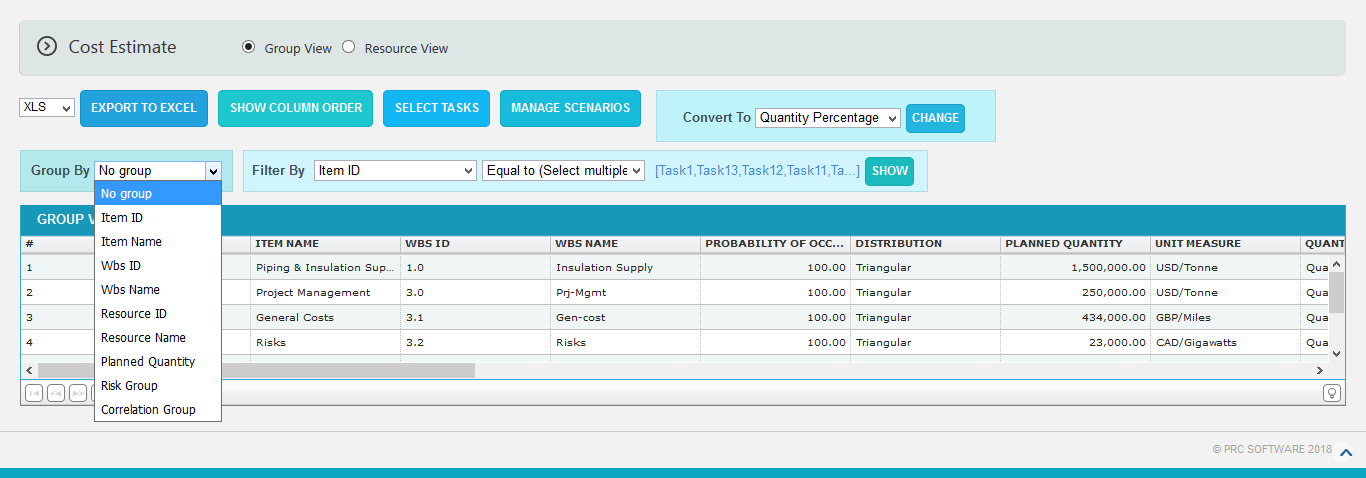
Figure 8
Convert To:
This functionality is used to convert the cost of all project tasks in Cost Value or Cost Percentage.
Steps:
- Cost Analysis—>Cost Estimate-->Group View
- Select the required cost conversion type from Convert To. (Figure 1)
- Click on CHANGE The converted type will update in the Group View table. (Figure 9)
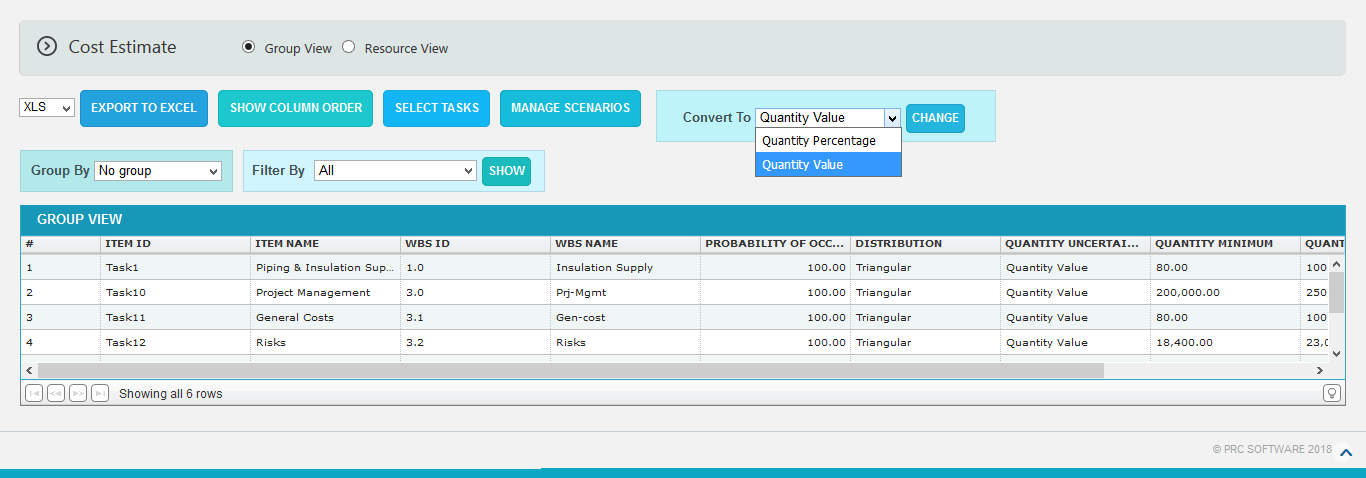
Figure 9
Export to Excel:
This functionality is used to export the whole Group View table or the filtered table to MS Excel as .xls or .xlsx files type.
Steps:
- Cost Analysis —> Cost Estimate —>Group View
- Select the file type from dropdown and click Export to Excel. (Figure 1)
Delete Tasks:
Tasks can be deleted by clicking the Delete icon corresponding to each row or multiple tasks can be deleted simultaneously.
Delete Multiple Tasks:
This functionality helps to delete multiple tasks simultaneously. To delete multiple tasks we must first select them by check marking the checkboxes next to each task.
Steps:
- Cost Analysis —> Cost Estimate —> Group View
- Click the SELECT TASKS button to select the tasks to delete. (Figure 1)
- Check the checkboxes to select the tasks. (Figure 10)
- Click the DELETE MULTIPLE button to delete the selected tasks. (Figure 10)
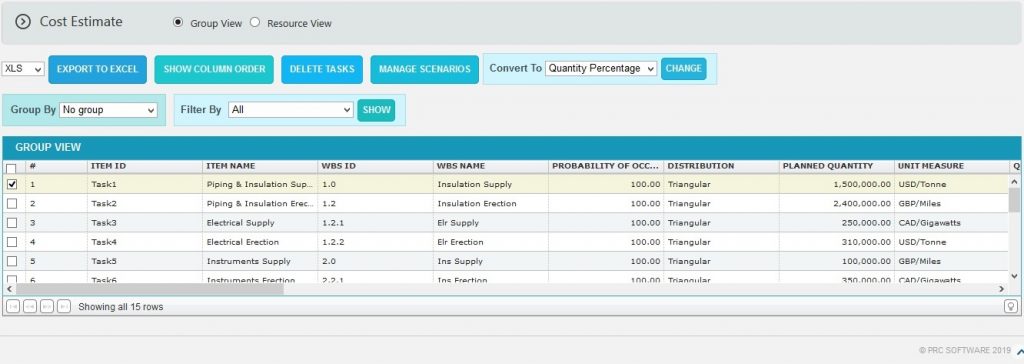
Figure 10
Delete Tasks Individually:
Steps:
- Cost Analysis —> Cost Estimate —> Group View
- Click the Delete icon corresponding to the required task to delete. (Figure 8)
Manage Scenarios:
This functionality is used to copy the selected scenario to a new scenario in the same project. And import tasks to the new scenario by selecting an import method again.
The scenario can be copied in 2 ways.
Create Scenario Without any data: This helps user to create a new scenario in the same project without any data from the existing scenario. (Figure11)
Clone from: `Scenario Name: This helps user to create a new scenario in the same project with all the data cloned from any of the existing scenario. (Figure 11)
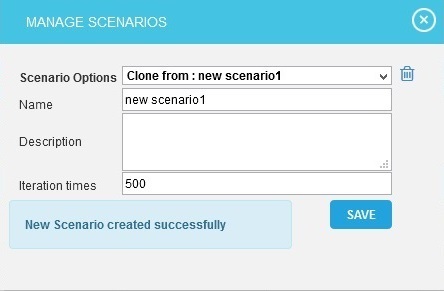
Figure 11
Steps:
- Cost Analysis —> Cost Estimate —> Group View
- Click Manage Scenarios button. A pop up appears. (Figure 11)
- Select the method to create a new scenario and input the name, description and the Iteration number. (Figure 11)
- Click SAVE button to create. (Figure 11)
Delete Scenario:
This functionality is used to delete the user defined scenarios from the project.
Steps:
- Cost Analysis —> Cost Estimate —> Group View
- Click Manage Scenarios button. A pop up appears (Figure 12)
- Select a scenario name from the combo and click delete icon. (Figure 10)
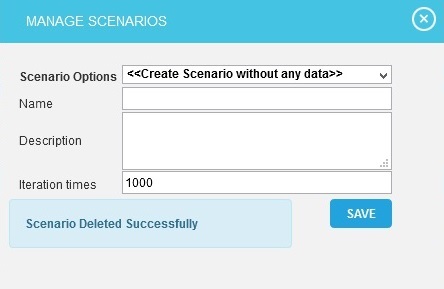
Figure 12
The Resource View section is used to view resource details such as Resource ID, Resource Name, Resource Type and Loading. (Figure 13) The Resource View is not possible to view if the selected import method is Simple Uncertainty.
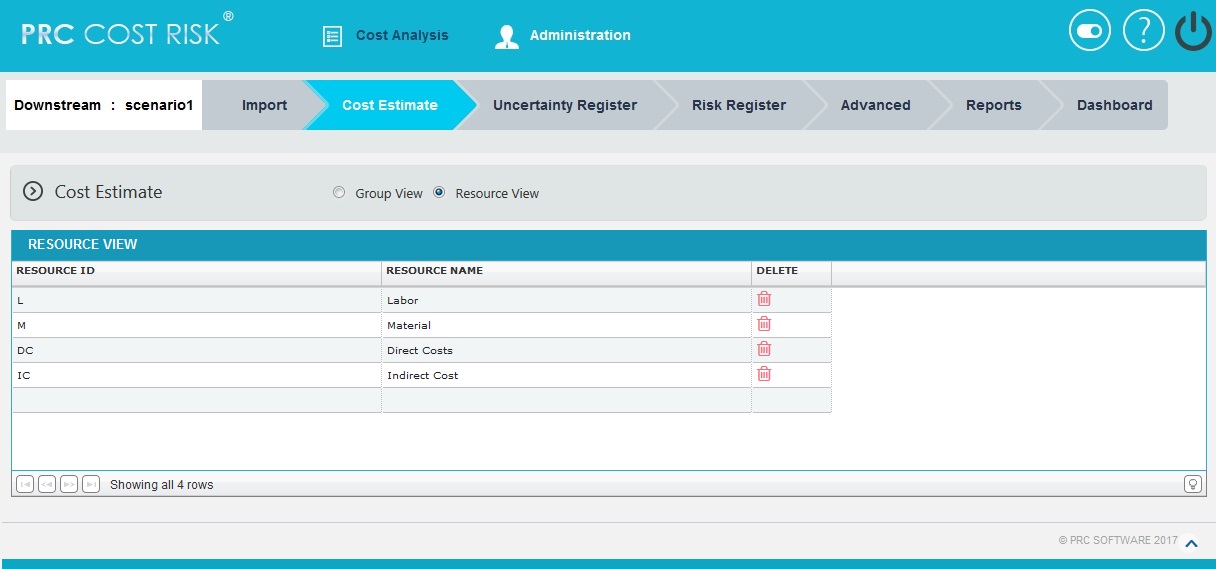
Figure 13