“Prevention is better than cure” and “A stitch in time saves nine”.
Project risk is defined by PMI as, “an uncertain event or condition that, if it occurs, has a positive or negative effect on a project’s objectives.”
It is important to note that Risk is an uncertain event. If it is something that will definitely occur, then it is a constraint or a task/activity/event and becomes a part of the Project.
A risk may negatively or positively impact the project schedule, cost, scope, quality, security/vulnerability, market value etc or a combination of any of these. Those Risks that negatively affect a project or a process are generally termed as Threats and those that have a positive impact are called Opportunities.
So we would take measures to enhance or exploit the opportunities and eliminate or reduce the impact of risks through Mitigation plans and Mitigation Steps. When we do this, there may occur additional Risks called secondary Risks which in turn may have a positive or negative impact on the aspects on the Project such as schedule, cost, scope, quality, security/vulnerability etc.
It is where we come to the point of careful analysis of the Risk. The question is where we would draw the line and what kind of decision would we make. Well, all that depends on the Risk Perception (or Risk Appetite) of the individuals and the organization, the Project Management methodologies, its culture, policies and procedures, the environment in which the Project takes place etc. This would vary from Project to Project.
How do we analyse Risk?
There are two widely accepted methods. One is a Qualitative Analysis and the other is Quantitative Analysis.
Qualitative Analysis
In Qualitative Analysis, we are grading the Risk, giving it a score, and a color indicating its severity based on Matrix.
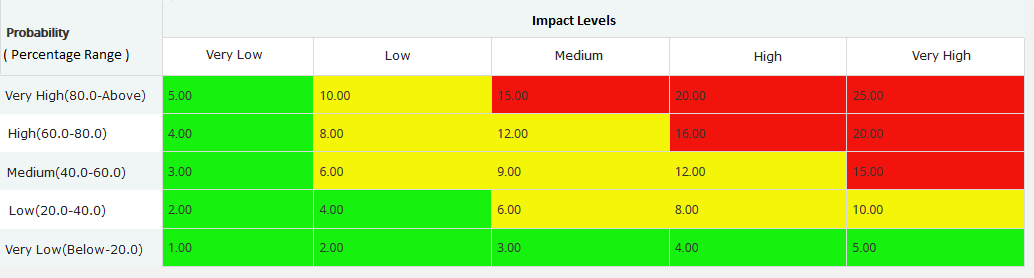 ( Fig 1.1 – Risk Matrix )
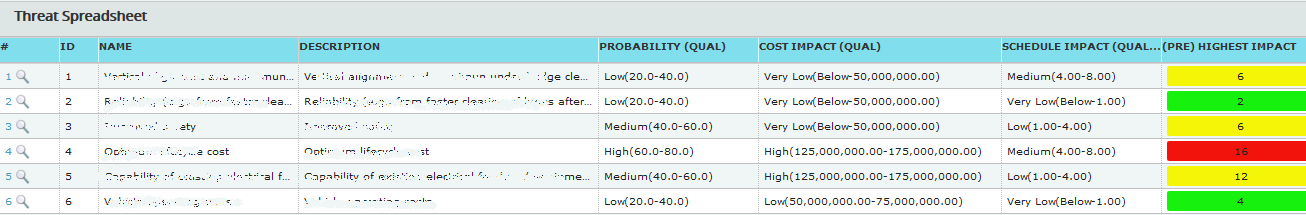 ( Fig 1.2 Sample Threats with its score values )
In the fig. 1.2, item number 4 is a high ranking Risk. It has a great chance of occurring and the cost impact is extremely high and could potentially jeopardise the Project itself. So this must be dealt with at the appropriate time.
A recent example would be the recent outbreak of Corona Virus in China. The impact is very high, from an analysis point of view, the probability of occurrence is Very Low. But then a few years ago there was Sars virus outbreak. So that would bump up the probability of a virus outbreak in that region to say Low. How do we mitigate this? That depends a lot on the type of industry as well as the status of the current Project. Say, for a software project development company, the impact could minimised by allowing employees to work remotely for a period of time. This may require additional infrastructure setup and hence extra cost and involve security issues but this could save a lot of time otherwise could cost on the schedule.
Risk monitoring is an ongoing process and has to be looked at regularly. This is the significance of Agile Methodologies such as Scrum. On the daily stand ups ( I hope those hard core Agile enthusiasts would forgive me ) you are in a way checking on the Schedule and making sure that the work gets done in time on daily basis. Whereas in the waterfall approach there has to be a prompt effort to check on the Schedule and the status of the project through the Monitoring and Control process on a regular basis.
Quantitative Analysis – Cost Monte Carlo Simulation
In Quantitative Analysis, the impact is usually measured in terms of Cost and Schedule. We would look at the Minimum, Most Likely and a Maximum values of Cost and Schedules items. For example, the optimistic cost for a developing a component is say $0.25M (that becomes the minimum value), the most likely cost is say $0.5M (that becomes the most likely value) and the worst case is say $1M (that becomes the maximum value). We then run it through a set of iterations of random numbers based on some distributions such as Triangle, Trigen, Uniform, Normal, Beta, Betapert etc. This is more popularly known as Monte Carlo Simulation. Every cost item is thus populated with say 1000 random values within its range and it is added up for the entire project. In chart below, the total cost of all items for each iteration is obtained and in this case it is rounded to the nearest 10,000 USD ( Bar Width ) and is plotted on the X axis and the number of times the same values gets repeated is plotted on the Y axis on the left. (There may also be other factors to consider when one cost depends or is impacted by another. This is handled by correlating the cost items.)
In order to obtain the confidence levels, we add up the hits progressively. So the total hits would be equated to 100%. In the sample below, we can say with 90% confidence that the Project would complete within $1.8M. This makes sense with larger projects there may be thousands and thousands of items and Finance Managers can make decisions on the contingency needed for the project at various stages.
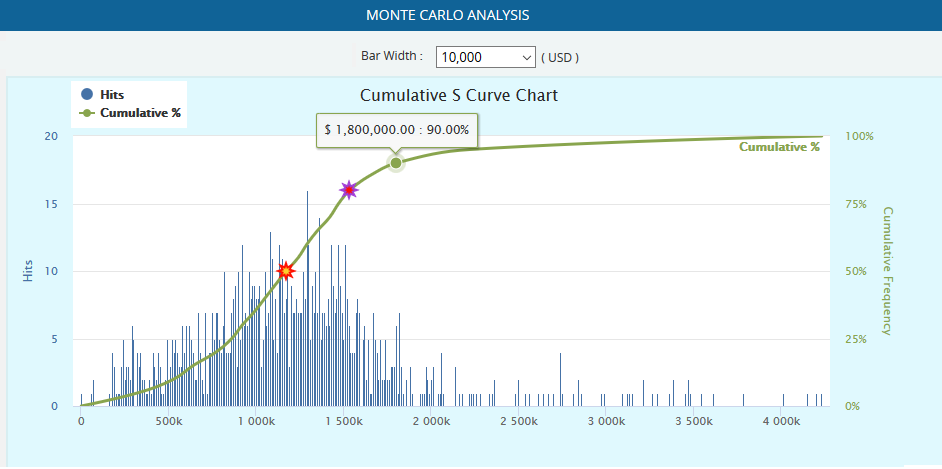 ( Fig. 1.3 Monte Carlo Simulation )
Quantitative Analysis – Schedule Monte Carlo Simulation
In the case of Schedule Monte Carlo Simulation, the random values for duration of the activities are done in a similar fashion as cost. But the activities have dependencies on other activities. For example testing an item can only begin after coding is completed. So we rely on the underlying mechanism of Gantt Chart ( For more info refer to https://en.wikipedia.org/wiki/Gantt_chart )for simulating Schedule. Since with each iteration of a random values in simulation, the critical path may vary and this is important to consider.
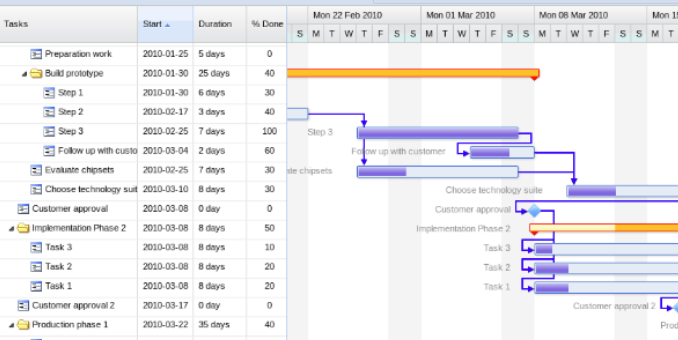 ( Fig 1.4 Bryntum Sample Gannt )
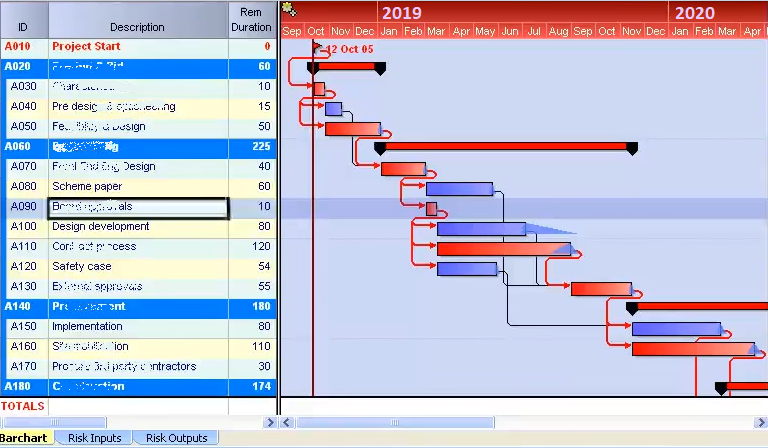 ( Fig 1.5 Pertmaster Sample Gantt )
The little arrows in both figures indicate the dependencies.
Some of the report that a Risk Manager would look at include
- Criticality Index ( CI ) – which is the number of time a particular task appears in the critical path in the iterations.
- Schedule Sensitivity Index ( SSI ) – CI x Standard Deviation of the Activity / Standard Deviation of the Project.
- Duration Sensitivity ( DS ) – Correlation of the Activity Duration with the Duration of the Project.
- Duration Criticality ( DC ) – CI x DS / 100
Once we have identified the significance of a Risk, we may determine appropriate strategies to deal with the Risk.
Risk Response Strategies
Avoid: Focus is on the cause and thus, eliminating the threat by eliminating the cause itself.
Mitigate: If the threat cannot be eliminated or is not cost effective, develop strategies to minimize the impact by acting on it.
Transfer: Transfer the threat to some other party through insurance, warranties, guarantees, etc.
Share: Sharing the risk through collaboration.
The strategies for Opportunities could be:
Exploit: Add work or change the project to make sure the opportunity occurs
Enhance: Increase the probability and positive impact of risk events
Share: Allocate ownership of opportunity to a third-party
Response strategies for both threats and opportunities:
Accept: Passive acceptance is to leave it as is for the moment and to take action if the Risk occurs. Active acceptance may involve contingency plans to be implemented if risk occurs and allocation of time and cost reserves to the project.
Escalate: If a Risk cannot be monitored or handled by the Project team, it must be escalated to the higher ups.
Once we decide on a response plan, we re-analyse the impact and the Risk Management is an ongoing process. Many organisation use MS Excel sheets for their Risk Management. But there are comprehensive web based and standalone tools such as Oracle Primavera, @RISK, PRC Software etc. for managing and documenting Risks. Some tools have the capability to roll up the Risks to portfolio level and Enterprise levels.