Risk Register Qualitative Inputs Simplified
It is important to pick a risk register format that is fit for purpose. Tracking more fields does not ensure that the data will be better. Sometimes tracking more fields causes each field to be documented less thoroughly. There is a benefit to tracking only the fields that are necessary. Additional fields can be added at any time based on need. Tracking five fields well can often be more powerful than tracking 50 fields with incomplete data. More fields increase the likelihood that fields will be given less individual attention. This article attempts to guide readers to streamline their risk register format.
Mandatory Minimum Fields (Qualitative Tracking)
- Risk ID – The risk should have a unique identifier. This can be as simple as a number, or a coding structure can be put in place. An example of coding is ENG.UNIT1.0001.
- Risk Statement – This field can be a short name, and a description can be another field, or the risk statement with description, cause, effect, etc. can be put in the same field. It is important that the register owner has a defined format and is consistent. The field may need to be actively managed as basis of probability and impact information have been included.
- Probability – What is the likelihood or probability that the risk will happen. This typically comes from a predefined list or could be a numeric value. A numeric value can always be put in the correct spot on the list. It is helpful to keep the list simple. Creating an intuitive list will be covered in another article.
- Impact – This field typically is chosen from a predefined list. A simple and intuitive list can be helpful.
Mandatory Minimum Fields (Quantitative Analysis)
- Probability – Numeric value for chance of risk occurring.
- Cost Impact – Cost the project will incur. A single point estimate can be used like in a cost estimate. A maximum value can be added to have a range. A likely value can be added to increase the accuracy of a Monte Carlo Analysis. The currency should be noted if the project has multiple currencies.
- Schedule Impact – The schedule impact can be tracked like the cost impact. The duration unit should be noted.
The fields above are the minimum required. The risk ID is needed to locate a risk in databases, etc. The risk name or statement defines the threat or opportunity and has basis information for the scoring and quantification. The probability illustrates whether a risk will occur. The impact highlights how damaging a threat is or how beneficial an opportunity could be. The Monte Carlo fields have been used in this example.
If a project stakeholder understands the risk, the probability of occurrence and the potential impact, then they will have enough information to rank the risk and decide how to act on it.
Additional Fields
- Status – The field can be added in or closed risks can be moved to an archive with only open risks in the main register. The field does not take any additional effort or much space. Open or closed are the two main options. The options can be increased based on filtering needs, but it is always helpful to only have additional options if you are going to use them.
- Owner – A risk owner may be helpful if individual people are assigned risk. In the example below, a separate document exists that outlines the risk owner based on the Risk ID structure. Example: All ENG risks are owned by the engineering manager.
- Short Name – An abbreviated name may be used for reporting purposes but should not need to be actively managed.
- Other Fields – Other fields can be added based on needs. If the field is not going to be used or is not needed, then consider removing the field. Extra fields can distract readers from the important data and take extra time to document and track.
- Risk Breakdown Structure (RBS) – This field is often tracked for filtering purposes. The RBS has been included in the Risk ID coding in this example.
- Risk Window / Risk Start / Risk Finish – Risk window is not needed due to the coding structure on the ID in the example provided. The reader knows that ENG risk events take place during engineering. If the project slips, then risk window dates need to be managed, however, if the project is tracking the engineering schedule, then the dates are not needed in the register. The risk event is linked to the schedule if a Monte Carlo Analysis is run, therefore tracking the field in the dates in the risk register. In this example we reference the Risk ID coding and project schedule as a supporting document.
Benefits of Simplification
A company can get as complicated as desired with qualitative inputs (red, amber, green, etc.). It is important to remember that the key to risk tracking is identifying whether something is bad and putting a plan in action to reduce the risk. Extra fields do not always add to this, and they may take extra time and effort to track.
Companies often rank risks by inputs such as:
- Probability
- Cost
- Schedule
- Political
- Safety
- Quality
- Technical
- Etc.
There is nothing wrong with tracking hundreds of fields and impact types; however, it is another area where it is easy to hit a point of diminishing returns. If a company tracks a field for probability to show if it will happen and a field for impact to show how bad it will be, then that is probably enough for most cases. Fewer fields are easier to view and digest. People tend to do a better job tracking a small number of things in detail than a huge list of items. The number of fields often reduces the quality of each field.
There should be a basis of risk input for each risk regardless, so tracking extra fields may not be needed unless a company has specific filtering needs for their risks.
Two scenarios are compared below with each input on a scale from 1 to 5:
Scenario 1:
- Probability = 3
- Cost = 2
- Schedule = 4
- Political = 2
- Safety = 1
- Quality = 2
- Technical = 4
Scenario 2:
- Probability = Above 50%
- Impact = High
- Basis – The change in design would cause an additional 12 to 14 weeks of schedule push as the new technology is tested and integrated into the existing design.
Scenario 2 tracked two inputs fields instead of seven; however, it is clearer due to the basis statement. The reduction in the number of fields did not have a negative impact on clarity and the overall risk score is unchanged.
Documenting a simple field will allow the process to be simplified. The key is to find something fit for purpose and not to chase theoretical perfection.
Example Risk Register
A set of reports has been generated based on the risk register below. Min and max cost values were added to smooth the curve; however, the fields were not needed to generate Monte Carlo charts.
The six fields shown allow the team to know what the risk is, rank it, quantify it for Monte Carlo Analysis and understand the basis for the ranking & quantification.
The number of fields may not seem like enough, however, the charts provided will allow the management team to easily see which risks need to be mitigated. The streamlined mitigation fields will be covered in another article.
| Risk ID | Risk Statement | Probability | Risk Impact | Cost Impact (USD) | Schedule Impact (Weeks) |
| PROC-UNIT1-0001 | There is a threat of delay in the delivery of the DCS system due to possible change in vendor. The chosen vendor may go bankrupt due to COVID-19 concerns and would not be able to fill the order. The probability is based on official correspondence with the vendor. The impact is based on four weeks for vendor selection and an estimated ten-week delay to the start of fabrication. The cost is based on the time delay, additional cost on the quote and expediting fees. | 50% | High | 2,000,000 | 14 |
| CNST-UNIT1-0001 | Acme Manufacturing has had minor quality issues on recent projects. This may require minor field work and adjustments with piping. The impact is ranked a medium as the issue impacts the critical path. | 80% | Medium | 30,000 | 2 |
| ENG-UNIT1-0001 | Unit 1 – Late vendor data. Day for day slip due to critical path | 25% | Medium | 500,000 | 6 |
| ENG-UNIT2-0002 | Unit 2 – Late vendor data. Low risk due to schedule float. | 5% | Low | 100,000 | 0 |
| CNST-UNIT1-0002 | Space issues for vessel. Currently working. This is critical path item. | 50% | High | 1,000,000 | 4 |
The charts are powered by:

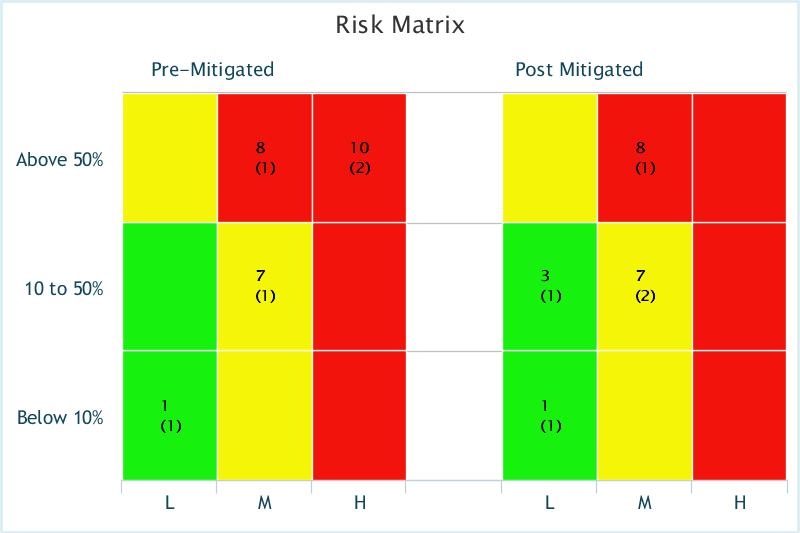
Threat-Score-Matrix
The threat matrix provides a summary of all threats in the project (pre-mitigated and post-mitigated) ranked by a score of one to ten.
Threats with a probability over 50% and a high impact on the project delivery are ranked a ten and are in the top-right corner. Risks are reduced in score as they go down or left on the matrix.
There is one red risk that has not been reduced by our actions. There are two yellow risks remaining. The risks are detailed in a separate chart.
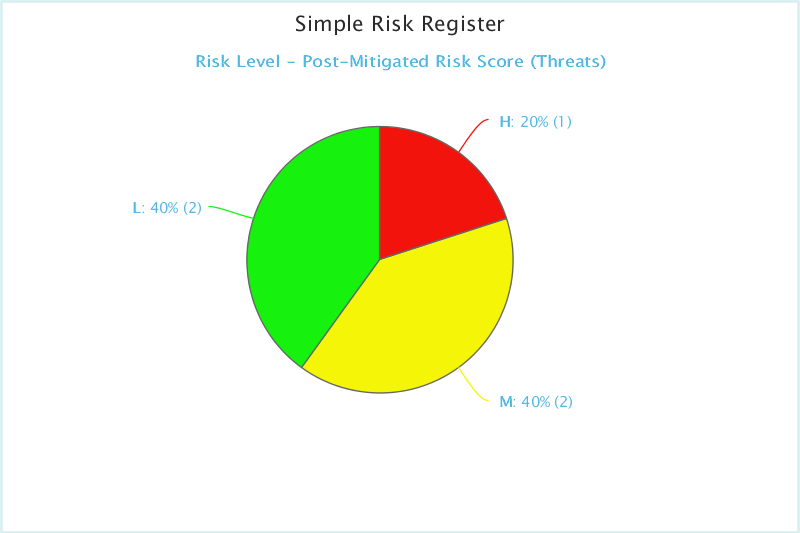
Risk Level – Pre-Mitigated Risk Score (Threats)
The threat Risk Level report illustrates the total number of threats distributed by red, yellow and green. The score after our mitigating actions is shown below.
There is one red risk that has not been reduced by our actions. There are two yellow risks remaining. The risks are detailed in a separate chart.
| Name | Score from | Score up to | Number of Risks |
| High | 8 | 10 | 1 |
| Medium | 4 | 8 | 2 |
| Low | 1 | 4 | 2 |
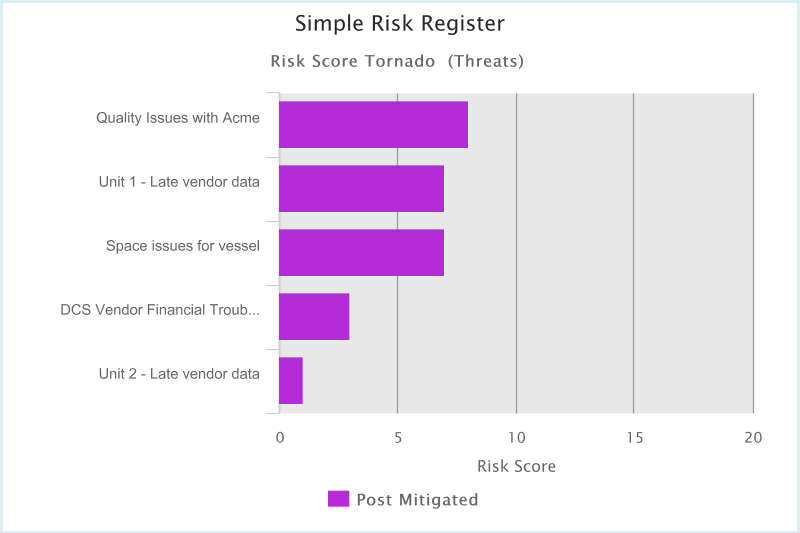
Tornado Chart (Post-Mitigated Risk Score):
The following risks on the chart are ranked by score after mitigation.
The Acme Manufacturing quality issue is the only red risk remaining. All other risks have been mitigated to a yellow score or below.
The red and yellow risks should be reviewed for further mitigation. The green risks pose a limited threat.
| Risk ID | Risk Name | Post-Mitigated |
| CNST-UNIT1-0001 | Quality Issues with Acme | 8 |
| ENG-UNIT1-0002 | Unit 1 – Late Vendor Data | 7 |
| ENG-UNIT1-0001 | Space Issues for Vessel | 7 |
| PROC-UNIT1-0001 | DCS Vendor Financial Troubles | 3 |
| ENG-UNIT2-0002 | Unit 2 – Late Vendor Data | 1 |
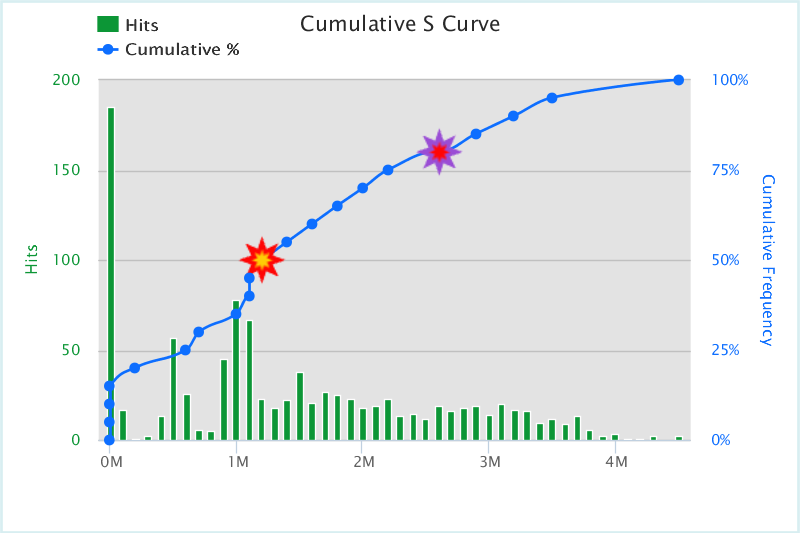
Cost Success Curve
The cost curve was generated by running a Monte Carlo Analysis on the risk register. The probability 50% (P50) and probability 80% (P80) are marked on the graph. The P50 is $1.44M USD. The P80 is $2.66M USD.
We are eighty percent confident of success with an additional $2.66M USD to cover for all open risk events.
| Probability of Success | Cost Exposure (Contingency Needed) |
| 5 | 19,442.15 |
| 10 | 28,456.27 |
| 15 | 32,365.34 |
| 20 | 488,883.37 |
| 25 | 626,330.17 |
| 30 | 970,408.33 |
| 35 | 1,029,057.37 |
| 40 | 1,085,100.81 |
| 45 | 1,203,837.85 |
| 50 | 1,439,434.06 |
| 55 | 1,589,005.16 |
| 60 | 1,741,364.52 |
| 65 | 1,945,946.21 |
| 70 | 2,191,779.66 |
| 75 | 2,370,765.26 |
| 80 | 2,660,695.84 |
| 85 | 2,890,902.78 |
| 90 | 3,167,002.68 |
| 95 | 3,564,704.14 |
Cost Values Isolated To P
The chart below shows the top cost drivers from the risk register Monte Carlo Analysis. The top risk is green from a qualitative ranking. The lowest risk is a red from a qualitative ranking. The cost inputs and rankings should be reviewed.
The DCS Vendor Risk accounts for more than half of the contingency at a success level of eighty percent.
The top three risks account for almost all the contingency on the project.
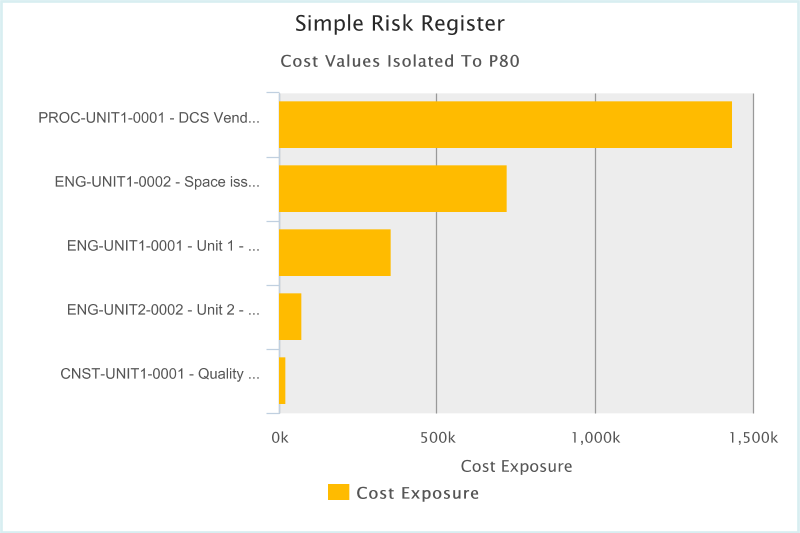
| Threat ID | Threat Name | Cost Exposure |
| PROC-UNIT1-0001 | DCS Vendor Financial Troubles | 1,437,564.36 |
| ENG-UNIT1-0002 | Space issues for vessel | 721,101.24 |
| ENG-UNIT1-0001 | Unit 1 – Late vendor data | 355,371.33 |
| ENG-UNIT2-0002 | Unit 2 – Late vendor data | 70,363.73 |
| CNST-UNIT1-0001 | Quality Issues with Acme | 22,048.18 |
Status Report (Threats):
The chart below shows the number of risks in open or closed status.
We have three risk events that are unmitigated and should be looked at for additional mitigation plans.
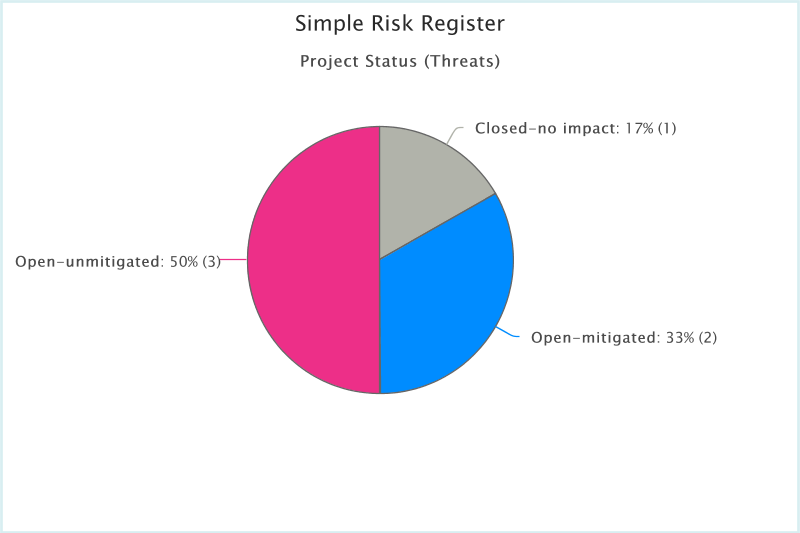
| Status | Number |
| Open-unmitigated | 3 |
| Open-mitigated | 2 |
| Closed-no impact | 1 |
| Risk Id | Risk Name | Status | Risk Colour |
| CNST-UNIT1-0001 | Quality Issues with Acme | Open-unmitigated | |
| ENG-UNIT1-0001 | Unit 1 – Late vendor data | Open-unmitigated | |
| ENG-UNIT2-0002 | Unit 2 – Late vendor data | Open-unmitigated | |
| ENG-UNIT1-0002 | Space issues for vessel | Open-mitigated | |
| PROC-UNIT1-0001 | DCS Vendor Financial Troubles | Open-mitigated | |
| CNST-UNIT2-0001 | Underground Obstruction | Closed-no impact |